Hmong vs Estonian Married-couple Households
COMPARE
Hmong
Estonian
Married-couple Households
Married-couple Households Comparison
Hmong
Estonians
47.0%
MARRIED-COUPLE HOUSEHOLDS
76.2/ 100
METRIC RATING
153rd/ 347
METRIC RANK
47.7%
MARRIED-COUPLE HOUSEHOLDS
94.7/ 100
METRIC RATING
107th/ 347
METRIC RANK
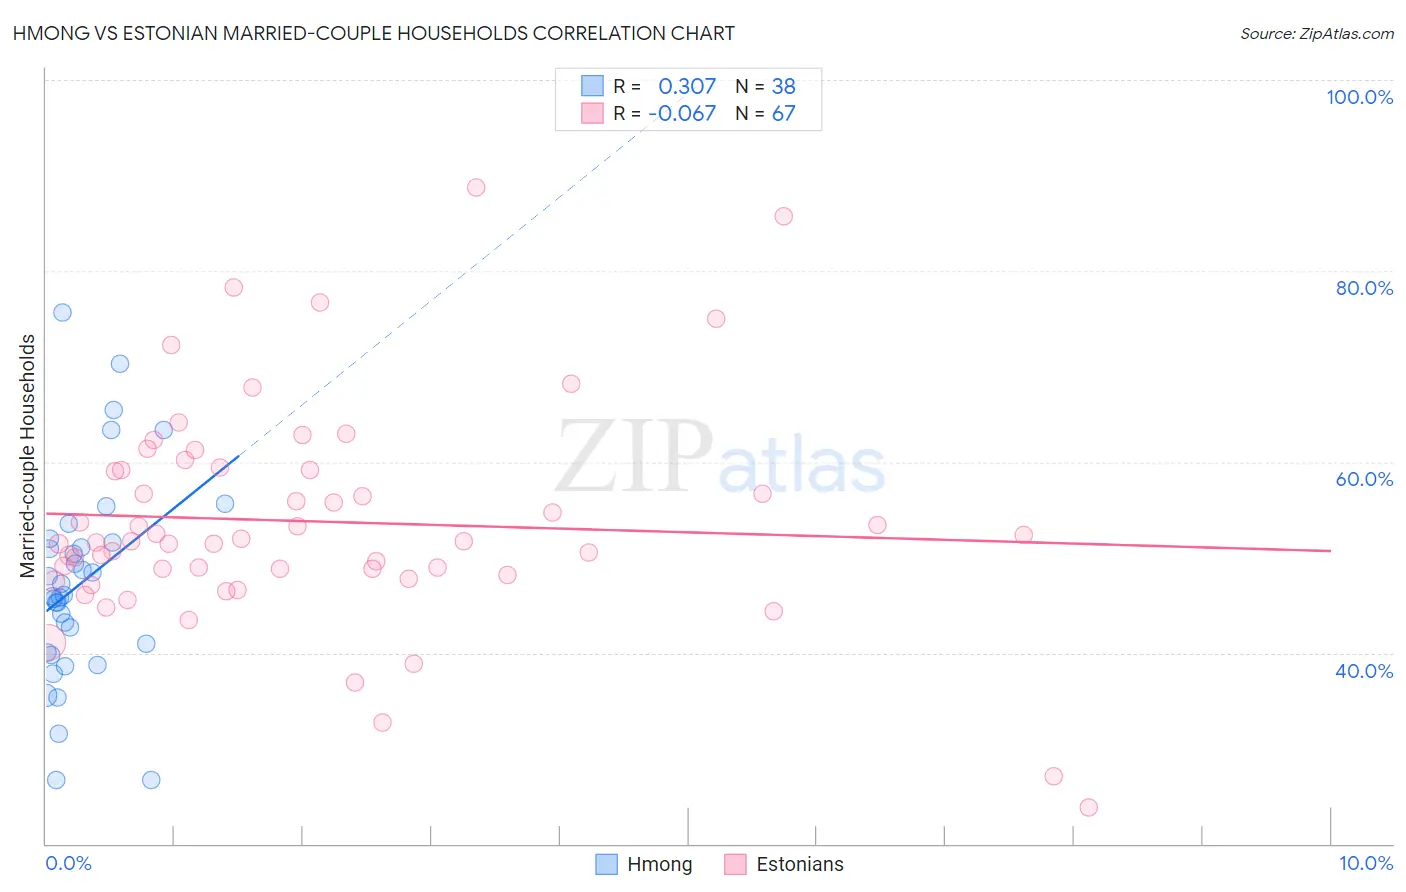
Hmong vs Estonian Married-couple Households Correlation Chart
The statistical analysis conducted on geographies consisting of 24,669,739 people shows a mild positive correlation between the proportion of Hmong and percentage of married-couple family households in the United States with a correlation coefficient (R) of 0.307 and weighted average of 47.0%. Similarly, the statistical analysis conducted on geographies consisting of 123,500,387 people shows a slight negative correlation between the proportion of Estonians and percentage of married-couple family households in the United States with a correlation coefficient (R) of -0.067 and weighted average of 47.7%, a difference of 1.6%.
Married-couple Households Correlation Summary
| Measurement | Hmong | Estonian |
| Minimum | 26.6% | 23.8% |
| Maximum | 75.6% | 88.8% |
| Range | 49.0% | 65.0% |
| Mean | 47.3% | 53.8% |
| Median | 46.0% | 51.7% |
| Interquartile 25% (IQ1) | 40.1% | 48.1% |
| Interquartile 75% (IQ3) | 51.6% | 59.1% |
| Interquartile Range (IQR) | 11.5% | 11.0% |
| Standard Deviation (Sample) | 10.7% | 11.6% |
| Standard Deviation (Population) | 10.6% | 11.5% |
Similar Demographics by Married-couple Households
Demographics Similar to Hmong by Married-couple Households
In terms of married-couple households, the demographic groups most similar to Hmong are Immigrants from Western Asia (46.9%, a difference of 0.0%), Serbian (47.0%, a difference of 0.010%), Arab (46.9%, a difference of 0.010%), Immigrants from Bulgaria (47.0%, a difference of 0.030%), and Armenian (46.9%, a difference of 0.040%).
| Demographics | Rating | Rank | Married-couple Households |
| Immigrants | Western Europe | 81.6 /100 | #146 | Excellent 47.1% |
| Immigrants | Syria | 81.6 /100 | #147 | Excellent 47.1% |
| Icelanders | 79.5 /100 | #148 | Good 47.0% |
| Paraguayans | 78.7 /100 | #149 | Good 47.0% |
| Immigrants | Russia | 77.6 /100 | #150 | Good 47.0% |
| Immigrants | Bulgaria | 76.8 /100 | #151 | Good 47.0% |
| Serbians | 76.3 /100 | #152 | Good 47.0% |
| Hmong | 76.2 /100 | #153 | Good 47.0% |
| Immigrants | Western Asia | 76.1 /100 | #154 | Good 46.9% |
| Arabs | 76.0 /100 | #155 | Good 46.9% |
| Armenians | 75.4 /100 | #156 | Good 46.9% |
| Immigrants | Oceania | 74.8 /100 | #157 | Good 46.9% |
| Immigrants | Nonimmigrants | 73.3 /100 | #158 | Good 46.9% |
| Osage | 73.2 /100 | #159 | Good 46.9% |
| Iraqis | 71.7 /100 | #160 | Good 46.9% |
Demographics Similar to Estonians by Married-couple Households
In terms of married-couple households, the demographic groups most similar to Estonians are Immigrants from Japan (47.7%, a difference of 0.050%), Immigrants from Jordan (47.7%, a difference of 0.10%), Macedonian (47.6%, a difference of 0.12%), Syrian (47.6%, a difference of 0.13%), and Peruvian (47.6%, a difference of 0.14%).
| Demographics | Rating | Rank | Married-couple Households |
| Immigrants | Italy | 96.3 /100 | #100 | Exceptional 47.9% |
| Turks | 96.1 /100 | #101 | Exceptional 47.8% |
| Slavs | 96.0 /100 | #102 | Exceptional 47.8% |
| Hawaiians | 96.0 /100 | #103 | Exceptional 47.8% |
| Immigrants | South Africa | 96.0 /100 | #104 | Exceptional 47.8% |
| Immigrants | Czechoslovakia | 95.5 /100 | #105 | Exceptional 47.8% |
| Portuguese | 95.5 /100 | #106 | Exceptional 47.8% |
| Estonians | 94.7 /100 | #107 | Exceptional 47.7% |
| Immigrants | Japan | 94.4 /100 | #108 | Exceptional 47.7% |
| Immigrants | Jordan | 94.1 /100 | #109 | Exceptional 47.7% |
| Macedonians | 93.9 /100 | #110 | Exceptional 47.6% |
| Syrians | 93.9 /100 | #111 | Exceptional 47.6% |
| Peruvians | 93.8 /100 | #112 | Exceptional 47.6% |
| Venezuelans | 93.8 /100 | #113 | Exceptional 47.6% |
| Immigrants | Europe | 93.7 /100 | #114 | Exceptional 47.6% |