Immigrants from Colombia vs Argentinean Family Households with Children
COMPARE
Immigrants from Colombia
Argentinean
Family Households with Children
Family Households with Children Comparison
Immigrants from Colombia
Argentineans
28.2%
FAMILY HOUSEHOLDS WITH CHILDREN
99.2/ 100
METRIC RATING
94th/ 347
METRIC RANK
27.6%
FAMILY HOUSEHOLDS WITH CHILDREN
78.5/ 100
METRIC RATING
150th/ 347
METRIC RANK
Immigrants from Colombia vs Argentinean Family Households with Children Correlation Chart
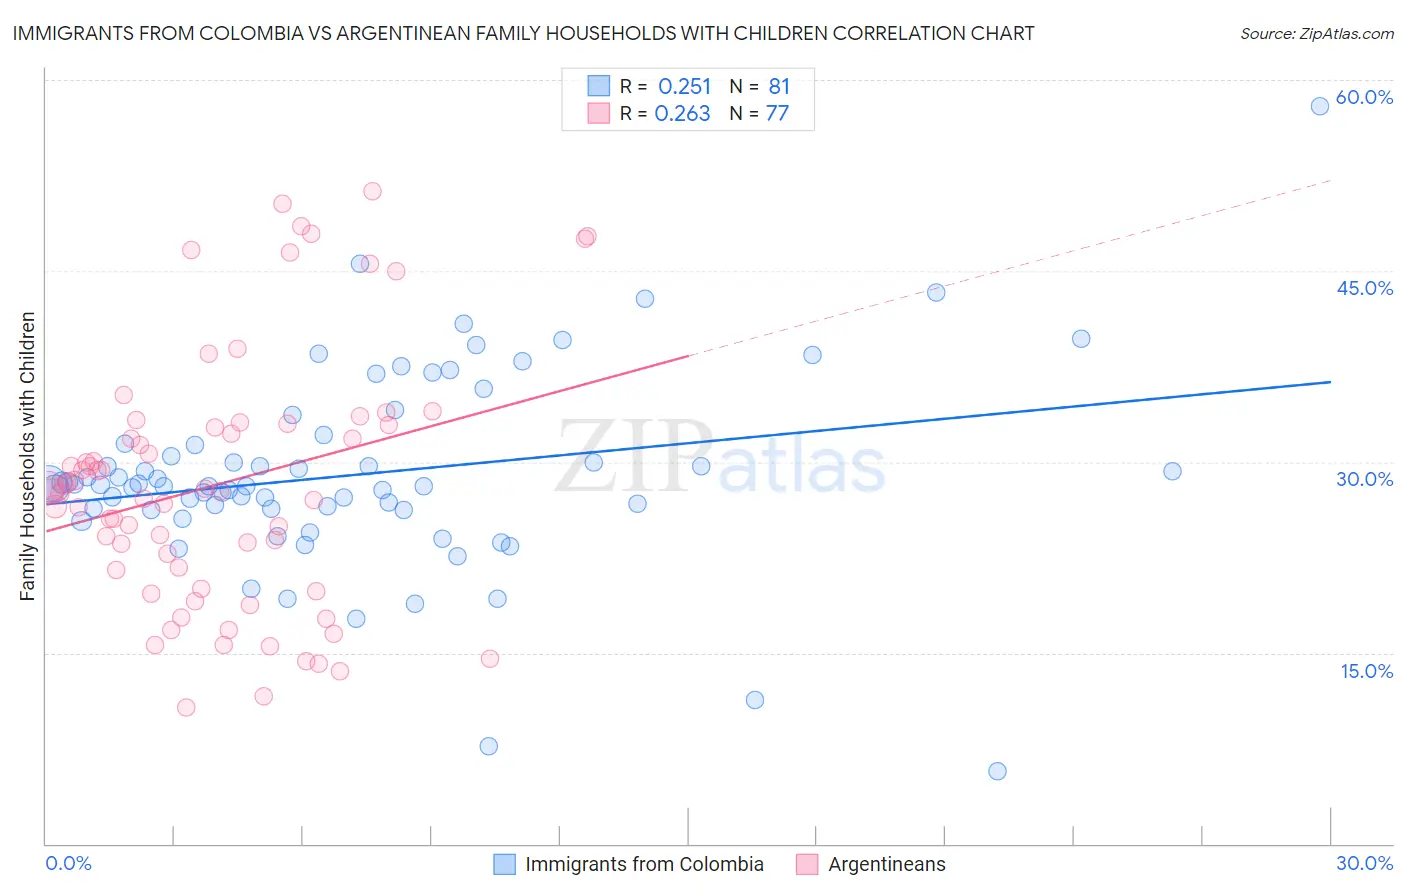
The statistical analysis conducted on geographies consisting of 378,425,142 people shows a weak positive correlation between the proportion of Immigrants from Colombia and percentage of family households with children in the United States with a correlation coefficient (R) of 0.251 and weighted average of 28.2%. Similarly, the statistical analysis conducted on geographies consisting of 296,871,630 people shows a weak positive correlation between the proportion of Argentineans and percentage of family households with children in the United States with a correlation coefficient (R) of 0.263 and weighted average of 27.6%, a difference of 1.9%.
Family Households with Children Correlation Summary
| Measurement | Immigrants from Colombia | Argentinean |
| Minimum | 5.7% | 10.7% |
| Maximum | 57.9% | 51.3% |
| Range | 52.2% | 40.6% |
| Mean | 29.0% | 28.2% |
| Median | 28.1% | 27.7% |
| Interquartile 25% (IQ1) | 26.3% | 20.8% |
| Interquartile 75% (IQ3) | 31.4% | 32.9% |
| Interquartile Range (IQR) | 5.1% | 12.1% |
| Standard Deviation (Sample) | 7.7% | 9.9% |
| Standard Deviation (Population) | 7.7% | 9.9% |
Similar Demographics by Family Households with Children
Demographics Similar to Immigrants from Colombia by Family Households with Children
In terms of family households with children, the demographic groups most similar to Immigrants from Colombia are Panamanian (28.2%, a difference of 0.050%), Immigrants from Nicaragua (28.2%, a difference of 0.070%), Ute (28.2%, a difference of 0.090%), Chickasaw (28.2%, a difference of 0.15%), and Chilean (28.1%, a difference of 0.15%).
| Demographics | Rating | Rank | Family Households with Children |
| Colombians | 99.6 /100 | #87 | Exceptional 28.3% |
| Liberians | 99.6 /100 | #88 | Exceptional 28.3% |
| Immigrants | Costa Rica | 99.6 /100 | #89 | Exceptional 28.3% |
| Immigrants | Thailand | 99.5 /100 | #90 | Exceptional 28.2% |
| Immigrants | Liberia | 99.4 /100 | #91 | Exceptional 28.2% |
| Chickasaw | 99.4 /100 | #92 | Exceptional 28.2% |
| Panamanians | 99.3 /100 | #93 | Exceptional 28.2% |
| Immigrants | Colombia | 99.2 /100 | #94 | Exceptional 28.2% |
| Immigrants | Nicaragua | 99.1 /100 | #95 | Exceptional 28.2% |
| Ute | 99.1 /100 | #96 | Exceptional 28.2% |
| Chileans | 98.9 /100 | #97 | Exceptional 28.1% |
| Immigrants | Kenya | 98.9 /100 | #98 | Exceptional 28.1% |
| Immigrants | Azores | 98.8 /100 | #99 | Exceptional 28.1% |
| Indonesians | 98.8 /100 | #100 | Exceptional 28.1% |
| Immigrants | Oceania | 98.8 /100 | #101 | Exceptional 28.1% |
Demographics Similar to Argentineans by Family Households with Children
In terms of family households with children, the demographic groups most similar to Argentineans are Menominee (27.6%, a difference of 0.010%), Immigrants from Moldova (27.6%, a difference of 0.020%), Osage (27.6%, a difference of 0.020%), Portuguese (27.6%, a difference of 0.020%), and Immigrants from Chile (27.7%, a difference of 0.030%).
| Demographics | Rating | Rank | Family Households with Children |
| Immigrants | Eastern Africa | 80.2 /100 | #143 | Excellent 27.7% |
| Brazilians | 79.6 /100 | #144 | Good 27.7% |
| Immigrants | Chile | 79.5 /100 | #145 | Good 27.7% |
| Basques | 79.5 /100 | #146 | Good 27.7% |
| Immigrants | Moldova | 79.1 /100 | #147 | Good 27.6% |
| Osage | 79.0 /100 | #148 | Good 27.6% |
| Menominee | 78.9 /100 | #149 | Good 27.6% |
| Argentineans | 78.5 /100 | #150 | Good 27.6% |
| Portuguese | 77.8 /100 | #151 | Good 27.6% |
| Ethiopians | 77.0 /100 | #152 | Good 27.6% |
| Immigrants | Cabo Verde | 75.6 /100 | #153 | Good 27.6% |
| Icelanders | 75.3 /100 | #154 | Good 27.6% |
| Comanche | 74.8 /100 | #155 | Good 27.6% |
| Hungarians | 74.6 /100 | #156 | Good 27.6% |
| Indians (Asian) | 71.6 /100 | #157 | Good 27.6% |