Hispanic or Latino vs Central American Family Households with Children
COMPARE
Hispanic or Latino
Central American
Family Households with Children
Family Households with Children Comparison
Hispanics or Latinos
Central Americans
29.9%
FAMILY HOUSEHOLDS WITH CHILDREN
100.0/ 100
METRIC RATING
17th/ 347
METRIC RANK
29.1%
FAMILY HOUSEHOLDS WITH CHILDREN
100.0/ 100
METRIC RATING
40th/ 347
METRIC RANK
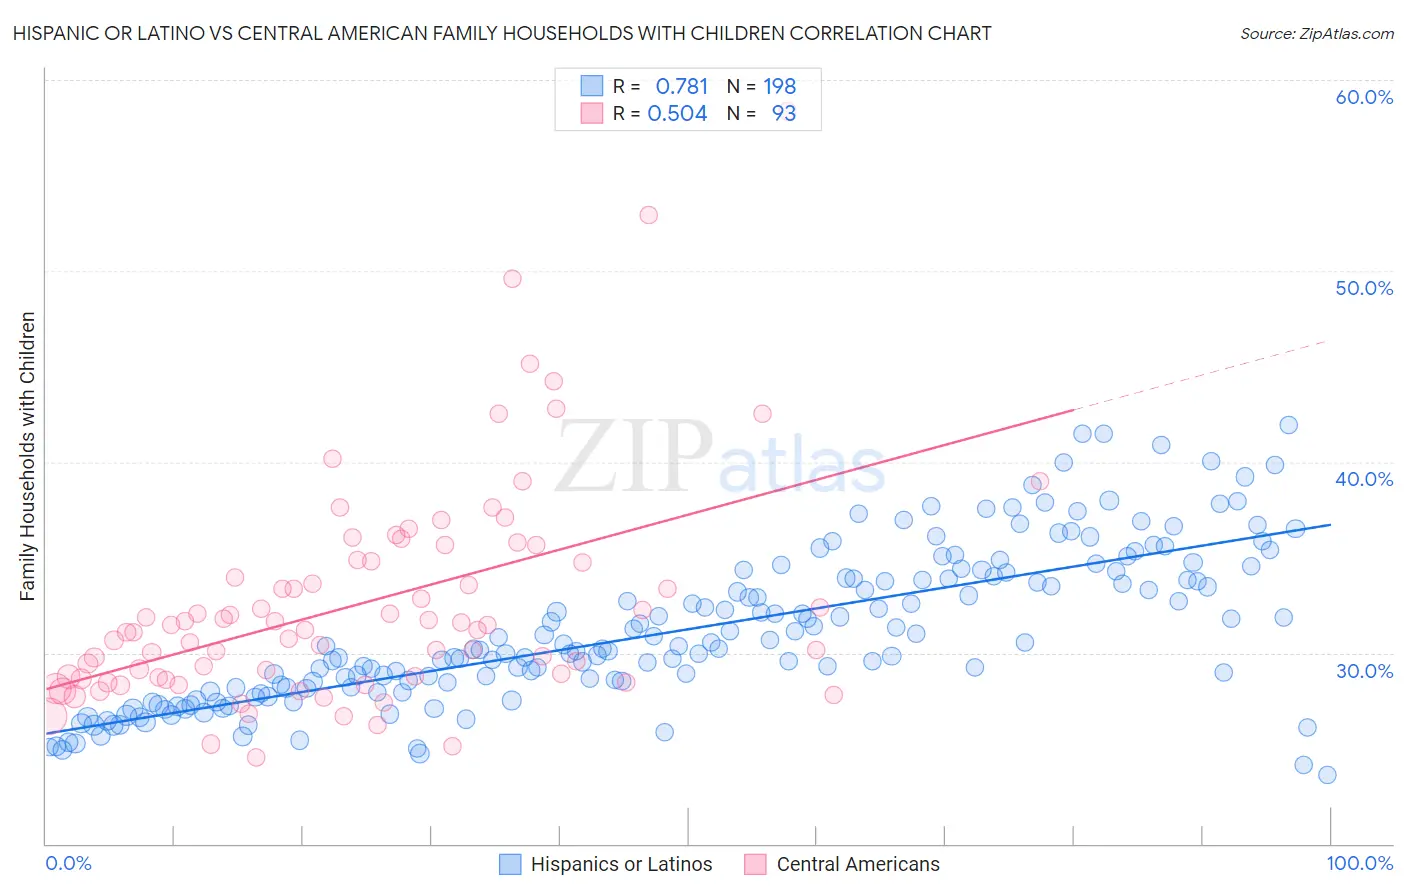
Hispanic or Latino vs Central American Family Households with Children Correlation Chart
The statistical analysis conducted on geographies consisting of 574,333,059 people shows a strong positive correlation between the proportion of Hispanics or Latinos and percentage of family households with children in the United States with a correlation coefficient (R) of 0.781 and weighted average of 29.9%. Similarly, the statistical analysis conducted on geographies consisting of 503,865,600 people shows a substantial positive correlation between the proportion of Central Americans and percentage of family households with children in the United States with a correlation coefficient (R) of 0.504 and weighted average of 29.1%, a difference of 2.7%.
Family Households with Children Correlation Summary
| Measurement | Hispanic or Latino | Central American |
| Minimum | 23.6% | 24.5% |
| Maximum | 41.9% | 58.3% |
| Range | 18.3% | 33.8% |
| Mean | 31.2% | 32.6% |
| Median | 30.3% | 31.2% |
| Interquartile 25% (IQ1) | 28.2% | 28.7% |
| Interquartile 75% (IQ3) | 33.9% | 34.8% |
| Interquartile Range (IQR) | 5.8% | 6.1% |
| Standard Deviation (Sample) | 4.0% | 5.8% |
| Standard Deviation (Population) | 4.0% | 5.8% |
Similar Demographics by Family Households with Children
Demographics Similar to Hispanics or Latinos by Family Households with Children
In terms of family households with children, the demographic groups most similar to Hispanics or Latinos are Salvadoran (29.9%, a difference of 0.19%), Alaska Native (29.9%, a difference of 0.22%), Immigrants from El Salvador (29.8%, a difference of 0.25%), Immigrants from Laos (29.8%, a difference of 0.30%), and Malaysian (29.8%, a difference of 0.33%).
| Demographics | Rating | Rank | Family Households with Children |
| Immigrants | Fiji | 100.0 /100 | #10 | Exceptional 30.5% |
| Nepalese | 100.0 /100 | #11 | Exceptional 30.5% |
| Immigrants | Pakistan | 100.0 /100 | #12 | Exceptional 30.2% |
| Afghans | 100.0 /100 | #13 | Exceptional 30.2% |
| Bangladeshis | 100.0 /100 | #14 | Exceptional 30.1% |
| Immigrants | South Central Asia | 100.0 /100 | #15 | Exceptional 30.0% |
| Immigrants | Afghanistan | 100.0 /100 | #16 | Exceptional 30.0% |
| Hispanics or Latinos | 100.0 /100 | #17 | Exceptional 29.9% |
| Salvadorans | 100.0 /100 | #18 | Exceptional 29.9% |
| Alaska Natives | 100.0 /100 | #19 | Exceptional 29.9% |
| Immigrants | El Salvador | 100.0 /100 | #20 | Exceptional 29.8% |
| Immigrants | Laos | 100.0 /100 | #21 | Exceptional 29.8% |
| Malaysians | 100.0 /100 | #22 | Exceptional 29.8% |
| Mexican American Indians | 100.0 /100 | #23 | Exceptional 29.7% |
| Guamanians/Chamorros | 100.0 /100 | #24 | Exceptional 29.7% |
Demographics Similar to Central Americans by Family Households with Children
In terms of family households with children, the demographic groups most similar to Central Americans are Yaqui (29.1%, a difference of 0.010%), Immigrants from South Eastern Asia (29.1%, a difference of 0.090%), Spanish American Indian (29.1%, a difference of 0.090%), Korean (29.2%, a difference of 0.16%), and Asian (29.1%, a difference of 0.28%).
| Demographics | Rating | Rank | Family Households with Children |
| Venezuelans | 100.0 /100 | #33 | Exceptional 29.4% |
| Immigrants | Bolivia | 100.0 /100 | #34 | Exceptional 29.3% |
| Immigrants | Sierra Leone | 100.0 /100 | #35 | Exceptional 29.3% |
| Immigrants | Venezuela | 100.0 /100 | #36 | Exceptional 29.3% |
| Immigrants | Cameroon | 100.0 /100 | #37 | Exceptional 29.2% |
| Koreans | 100.0 /100 | #38 | Exceptional 29.2% |
| Yaqui | 100.0 /100 | #39 | Exceptional 29.1% |
| Central Americans | 100.0 /100 | #40 | Exceptional 29.1% |
| Immigrants | South Eastern Asia | 100.0 /100 | #41 | Exceptional 29.1% |
| Spanish American Indians | 100.0 /100 | #42 | Exceptional 29.1% |
| Asians | 100.0 /100 | #43 | Exceptional 29.1% |
| Immigrants | Taiwan | 100.0 /100 | #44 | Exceptional 29.0% |
| Fijians | 100.0 /100 | #45 | Exceptional 29.0% |
| Immigrants | Philippines | 100.0 /100 | #46 | Exceptional 29.0% |
| Peruvians | 100.0 /100 | #47 | Exceptional 29.0% |