Guatemalan vs Houma Family Households with Children
COMPARE
Guatemalan
Houma
Family Households with Children
Family Households with Children Comparison
Guatemalans
Houma
28.9%
FAMILY HOUSEHOLDS WITH CHILDREN
100.0/ 100
METRIC RATING
52nd/ 347
METRIC RANK
28.5%
FAMILY HOUSEHOLDS WITH CHILDREN
99.9/ 100
METRIC RATING
68th/ 347
METRIC RANK
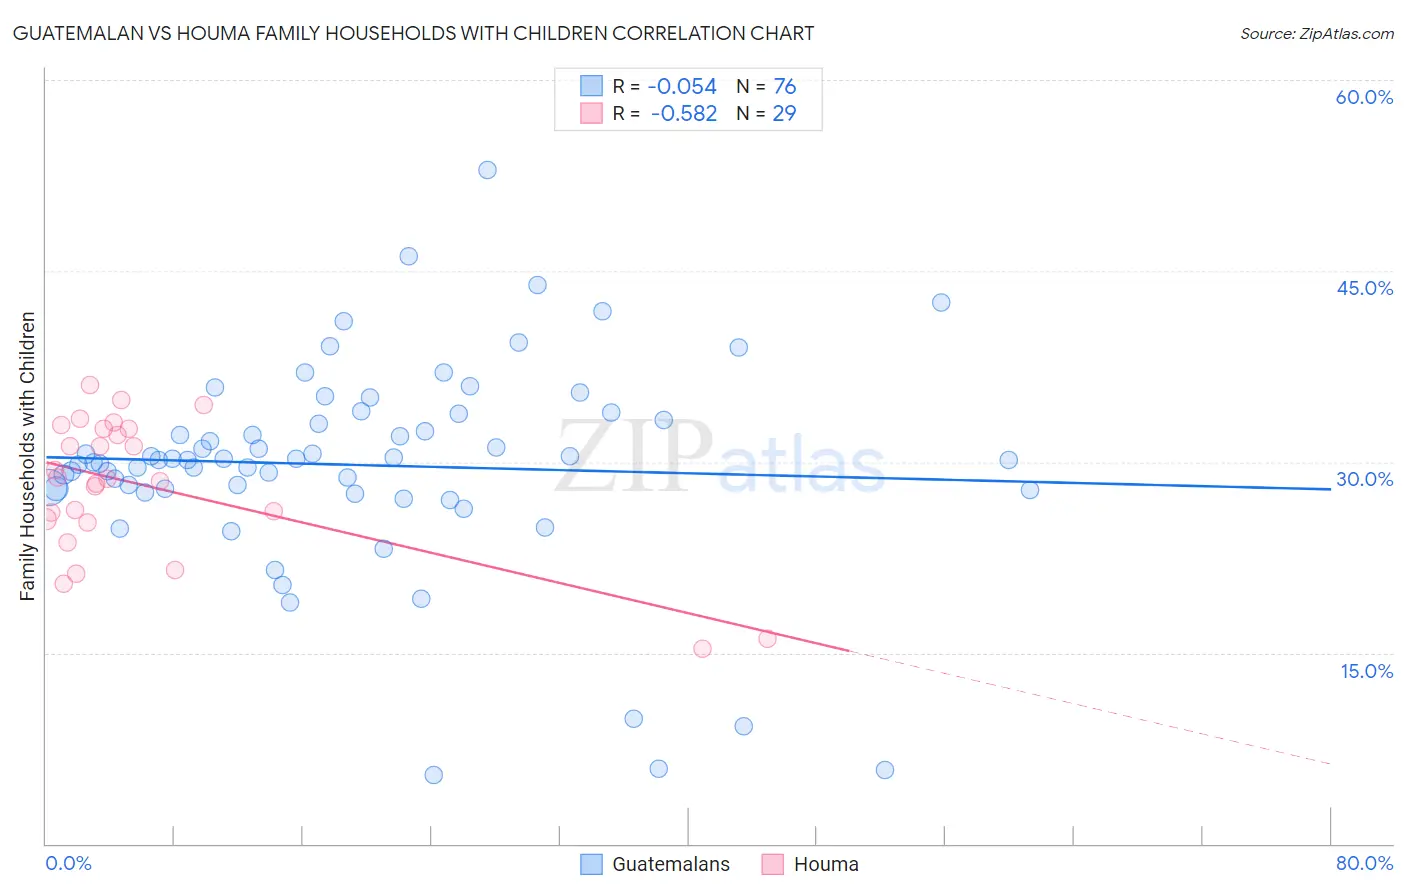
Guatemalan vs Houma Family Households with Children Correlation Chart
The statistical analysis conducted on geographies consisting of 409,222,746 people shows a slight negative correlation between the proportion of Guatemalans and percentage of family households with children in the United States with a correlation coefficient (R) of -0.054 and weighted average of 28.9%. Similarly, the statistical analysis conducted on geographies consisting of 36,792,477 people shows a substantial negative correlation between the proportion of Houma and percentage of family households with children in the United States with a correlation coefficient (R) of -0.582 and weighted average of 28.5%, a difference of 1.3%.
Family Households with Children Correlation Summary
| Measurement | Guatemalan | Houma |
| Minimum | 5.4% | 15.3% |
| Maximum | 52.9% | 36.0% |
| Range | 47.5% | 20.7% |
| Mean | 29.8% | 28.1% |
| Median | 30.1% | 28.7% |
| Interquartile 25% (IQ1) | 27.8% | 25.4% |
| Interquartile 75% (IQ3) | 33.5% | 32.6% |
| Interquartile Range (IQR) | 5.7% | 7.3% |
| Standard Deviation (Sample) | 8.3% | 5.4% |
| Standard Deviation (Population) | 8.3% | 5.3% |
Demographics Similar to Guatemalans and Houma by Family Households with Children
In terms of family households with children, the demographic groups most similar to Guatemalans are Immigrants from Cambodia (28.9%, a difference of 0.070%), Immigrants from Peru (28.9%, a difference of 0.080%), Immigrants (28.9%, a difference of 0.11%), Sierra Leonean (28.9%, a difference of 0.15%), and Immigrants from Asia (28.8%, a difference of 0.21%). Similarly, the demographic groups most similar to Houma are Honduran (28.5%, a difference of 0.020%), Immigrants from Egypt (28.5%, a difference of 0.020%), Ghanaian (28.5%, a difference of 0.020%), Immigrants from Korea (28.5%, a difference of 0.020%), and Immigrants from Honduras (28.5%, a difference of 0.070%).
| Demographics | Rating | Rank | Family Households with Children |
| Immigrants | Immigrants | 100.0 /100 | #50 | Exceptional 28.9% |
| Immigrants | Peru | 100.0 /100 | #51 | Exceptional 28.9% |
| Guatemalans | 100.0 /100 | #52 | Exceptional 28.9% |
| Immigrants | Cambodia | 100.0 /100 | #53 | Exceptional 28.9% |
| Sierra Leoneans | 100.0 /100 | #54 | Exceptional 28.9% |
| Immigrants | Asia | 100.0 /100 | #55 | Exceptional 28.8% |
| Immigrants | Guatemala | 100.0 /100 | #56 | Exceptional 28.8% |
| Danes | 100.0 /100 | #57 | Exceptional 28.7% |
| Hawaiians | 100.0 /100 | #58 | Exceptional 28.7% |
| Immigrants | Nigeria | 100.0 /100 | #59 | Exceptional 28.6% |
| Hmong | 99.9 /100 | #60 | Exceptional 28.6% |
| Immigrants | Ghana | 99.9 /100 | #61 | Exceptional 28.6% |
| Egyptians | 99.9 /100 | #62 | Exceptional 28.6% |
| Immigrants | Lebanon | 99.9 /100 | #63 | Exceptional 28.6% |
| Filipinos | 99.9 /100 | #64 | Exceptional 28.6% |
| Hondurans | 99.9 /100 | #65 | Exceptional 28.5% |
| Immigrants | Egypt | 99.9 /100 | #66 | Exceptional 28.5% |
| Ghanaians | 99.9 /100 | #67 | Exceptional 28.5% |
| Houma | 99.9 /100 | #68 | Exceptional 28.5% |
| Immigrants | Korea | 99.9 /100 | #69 | Exceptional 28.5% |
| Immigrants | Honduras | 99.9 /100 | #70 | Exceptional 28.5% |