German vs Immigrants from Jordan Single Father Households
COMPARE
German
Immigrants from Jordan
Single Father Households
Single Father Households Comparison
Germans
Immigrants from Jordan
2.4%
SINGLE FATHER HOUSEHOLDS
28.0/ 100
METRIC RATING
197th/ 347
METRIC RANK
2.2%
SINGLE FATHER HOUSEHOLDS
96.6/ 100
METRIC RATING
131st/ 347
METRIC RANK
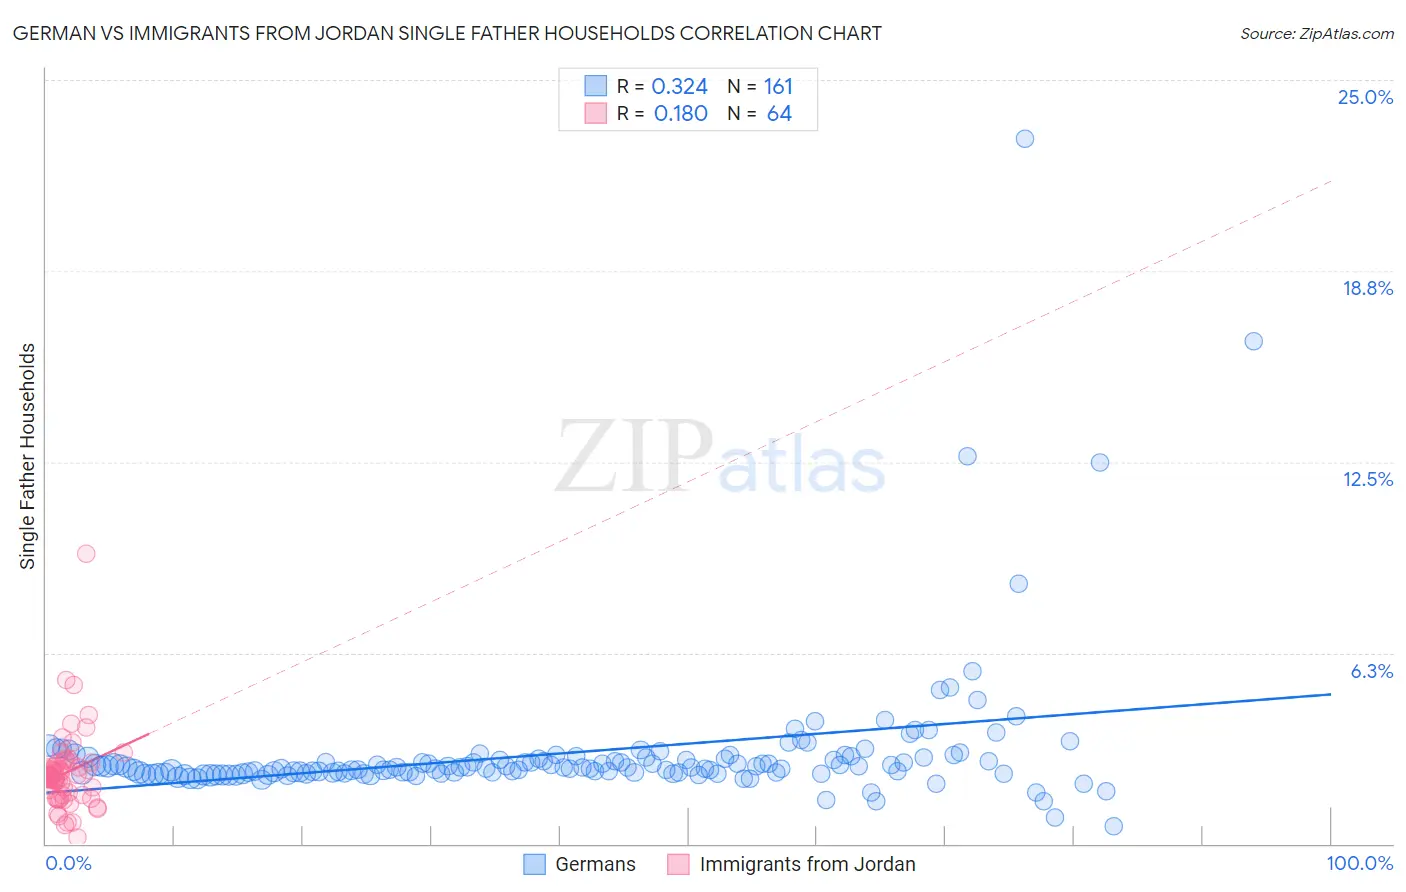
German vs Immigrants from Jordan Single Father Households Correlation Chart
The statistical analysis conducted on geographies consisting of 562,897,212 people shows a mild positive correlation between the proportion of Germans and percentage of single father households in the United States with a correlation coefficient (R) of 0.324 and weighted average of 2.4%. Similarly, the statistical analysis conducted on geographies consisting of 180,756,451 people shows a poor positive correlation between the proportion of Immigrants from Jordan and percentage of single father households in the United States with a correlation coefficient (R) of 0.180 and weighted average of 2.2%, a difference of 8.4%.
Single Father Households Correlation Summary
| Measurement | German | Immigrants from Jordan |
| Minimum | 0.56% | 0.21% |
| Maximum | 23.1% | 9.5% |
| Range | 22.5% | 9.3% |
| Mean | 3.0% | 2.3% |
| Median | 2.5% | 2.2% |
| Interquartile 25% (IQ1) | 2.3% | 1.6% |
| Interquartile 75% (IQ3) | 2.8% | 2.7% |
| Interquartile Range (IQR) | 0.50% | 1.1% |
| Standard Deviation (Sample) | 2.4% | 1.3% |
| Standard Deviation (Population) | 2.3% | 1.3% |
Similar Demographics by Single Father Households
Demographics Similar to Germans by Single Father Households
In terms of single father households, the demographic groups most similar to Germans are Kenyan (2.4%, a difference of 0.0%), Scandinavian (2.4%, a difference of 0.050%), Immigrants from Philippines (2.4%, a difference of 0.060%), Immigrants from Vietnam (2.4%, a difference of 0.080%), and Peruvian (2.4%, a difference of 0.080%).
| Demographics | Rating | Rank | Single Father Households |
| French | 31.7 /100 | #190 | Fair 2.4% |
| Immigrants | Africa | 30.0 /100 | #191 | Fair 2.4% |
| Immigrants | Sudan | 29.8 /100 | #192 | Fair 2.4% |
| Uruguayans | 29.7 /100 | #193 | Fair 2.4% |
| Panamanians | 29.6 /100 | #194 | Fair 2.4% |
| Immigrants | Philippines | 28.7 /100 | #195 | Fair 2.4% |
| Kenyans | 28.0 /100 | #196 | Fair 2.4% |
| Germans | 28.0 /100 | #197 | Fair 2.4% |
| Scandinavians | 27.4 /100 | #198 | Fair 2.4% |
| Immigrants | Vietnam | 27.1 /100 | #199 | Fair 2.4% |
| Peruvians | 27.1 /100 | #200 | Fair 2.4% |
| Immigrants | Uganda | 26.0 /100 | #201 | Fair 2.4% |
| German Russians | 25.7 /100 | #202 | Fair 2.4% |
| French Canadians | 24.7 /100 | #203 | Fair 2.4% |
| Ecuadorians | 24.5 /100 | #204 | Fair 2.4% |
Demographics Similar to Immigrants from Jordan by Single Father Households
In terms of single father households, the demographic groups most similar to Immigrants from Jordan are Polish (2.2%, a difference of 0.020%), Immigrants from Chile (2.2%, a difference of 0.060%), Taiwanese (2.2%, a difference of 0.13%), Serbian (2.2%, a difference of 0.17%), and Immigrants from England (2.2%, a difference of 0.18%).
| Demographics | Rating | Rank | Single Father Households |
| British West Indians | 97.4 /100 | #124 | Exceptional 2.2% |
| Immigrants | Indonesia | 97.4 /100 | #125 | Exceptional 2.2% |
| Moroccans | 96.9 /100 | #126 | Exceptional 2.2% |
| Jordanians | 96.9 /100 | #127 | Exceptional 2.2% |
| Immigrants | England | 96.8 /100 | #128 | Exceptional 2.2% |
| Serbians | 96.8 /100 | #129 | Exceptional 2.2% |
| Immigrants | Chile | 96.7 /100 | #130 | Exceptional 2.2% |
| Immigrants | Jordan | 96.6 /100 | #131 | Exceptional 2.2% |
| Poles | 96.5 /100 | #132 | Exceptional 2.2% |
| Taiwanese | 96.3 /100 | #133 | Exceptional 2.2% |
| Zimbabweans | 95.1 /100 | #134 | Exceptional 2.2% |
| Syrians | 94.8 /100 | #135 | Exceptional 2.2% |
| Chileans | 94.5 /100 | #136 | Exceptional 2.2% |
| Austrians | 94.2 /100 | #137 | Exceptional 2.2% |
| West Indians | 94.1 /100 | #138 | Exceptional 2.2% |