German vs Immigrants from Guyana Single Father Households
COMPARE
German
Immigrants from Guyana
Single Father Households
Single Father Households Comparison
Germans
Immigrants from Guyana
2.4%
SINGLE FATHER HOUSEHOLDS
28.0/ 100
METRIC RATING
197th/ 347
METRIC RANK
2.1%
SINGLE FATHER HOUSEHOLDS
99.4/ 100
METRIC RATING
91st/ 347
METRIC RANK
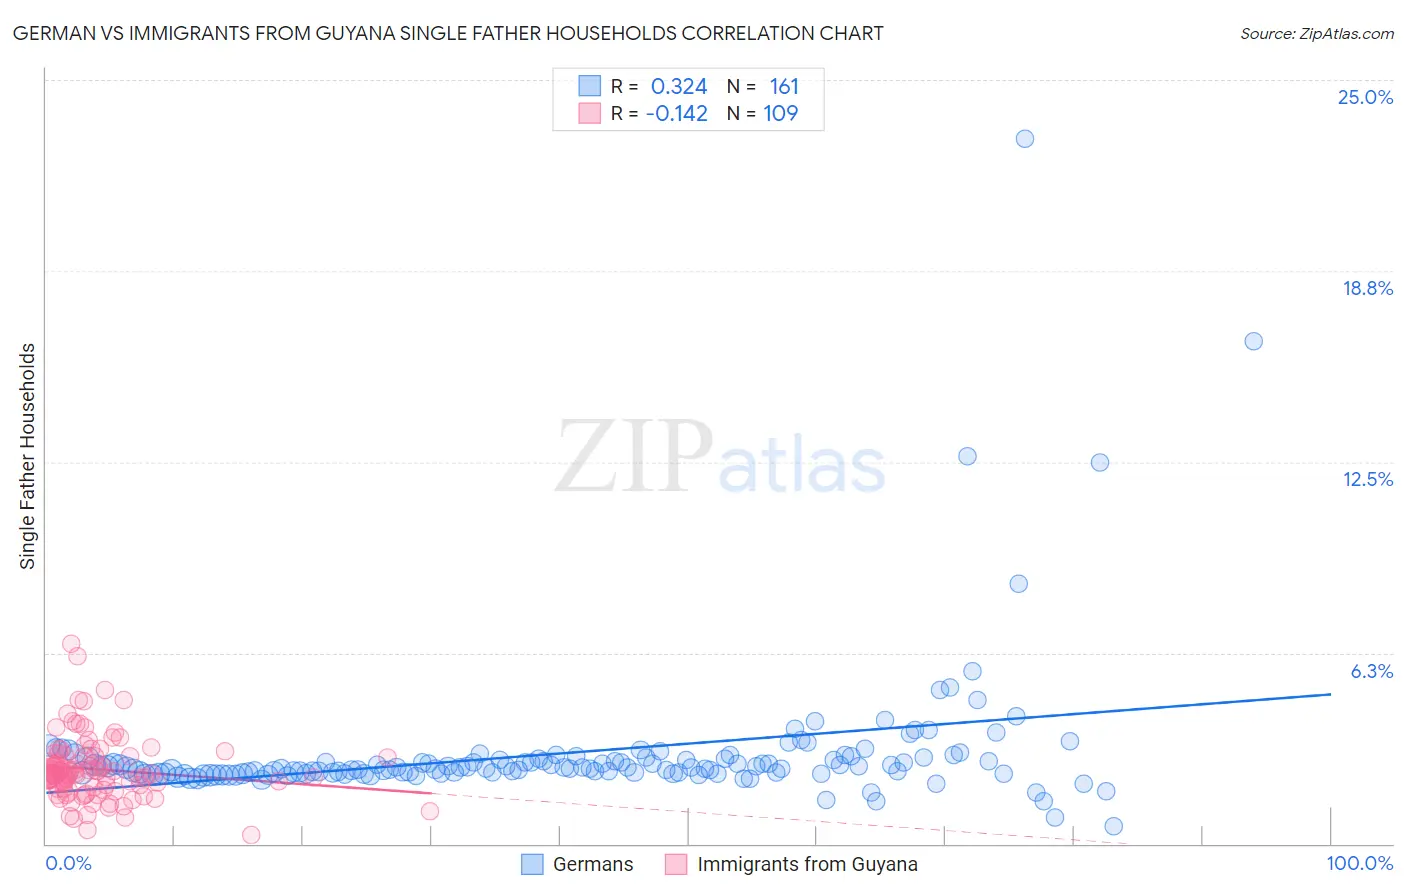
German vs Immigrants from Guyana Single Father Households Correlation Chart
The statistical analysis conducted on geographies consisting of 562,897,212 people shows a mild positive correlation between the proportion of Germans and percentage of single father households in the United States with a correlation coefficient (R) of 0.324 and weighted average of 2.4%. Similarly, the statistical analysis conducted on geographies consisting of 182,864,099 people shows a poor negative correlation between the proportion of Immigrants from Guyana and percentage of single father households in the United States with a correlation coefficient (R) of -0.142 and weighted average of 2.1%, a difference of 12.2%.
Single Father Households Correlation Summary
| Measurement | German | Immigrants from Guyana |
| Minimum | 0.56% | 0.28% |
| Maximum | 23.1% | 6.5% |
| Range | 22.5% | 6.3% |
| Mean | 3.0% | 2.4% |
| Median | 2.5% | 2.3% |
| Interquartile 25% (IQ1) | 2.3% | 1.8% |
| Interquartile 75% (IQ3) | 2.8% | 2.9% |
| Interquartile Range (IQR) | 0.50% | 1.0% |
| Standard Deviation (Sample) | 2.4% | 1.0% |
| Standard Deviation (Population) | 2.3% | 1.0% |
Similar Demographics by Single Father Households
Demographics Similar to Germans by Single Father Households
In terms of single father households, the demographic groups most similar to Germans are Kenyan (2.4%, a difference of 0.0%), Scandinavian (2.4%, a difference of 0.050%), Immigrants from Philippines (2.4%, a difference of 0.060%), Immigrants from Vietnam (2.4%, a difference of 0.080%), and Peruvian (2.4%, a difference of 0.080%).
| Demographics | Rating | Rank | Single Father Households |
| French | 31.7 /100 | #190 | Fair 2.4% |
| Immigrants | Africa | 30.0 /100 | #191 | Fair 2.4% |
| Immigrants | Sudan | 29.8 /100 | #192 | Fair 2.4% |
| Uruguayans | 29.7 /100 | #193 | Fair 2.4% |
| Panamanians | 29.6 /100 | #194 | Fair 2.4% |
| Immigrants | Philippines | 28.7 /100 | #195 | Fair 2.4% |
| Kenyans | 28.0 /100 | #196 | Fair 2.4% |
| Germans | 28.0 /100 | #197 | Fair 2.4% |
| Scandinavians | 27.4 /100 | #198 | Fair 2.4% |
| Immigrants | Vietnam | 27.1 /100 | #199 | Fair 2.4% |
| Peruvians | 27.1 /100 | #200 | Fair 2.4% |
| Immigrants | Uganda | 26.0 /100 | #201 | Fair 2.4% |
| German Russians | 25.7 /100 | #202 | Fair 2.4% |
| French Canadians | 24.7 /100 | #203 | Fair 2.4% |
| Ecuadorians | 24.5 /100 | #204 | Fair 2.4% |
Demographics Similar to Immigrants from Guyana by Single Father Households
In terms of single father households, the demographic groups most similar to Immigrants from Guyana are Romanian (2.1%, a difference of 0.090%), Croatian (2.1%, a difference of 0.20%), Ukrainian (2.1%, a difference of 0.20%), Immigrants from Pakistan (2.1%, a difference of 0.24%), and Immigrants from Armenia (2.1%, a difference of 0.25%).
| Demographics | Rating | Rank | Single Father Households |
| Carpatho Rusyns | 99.6 /100 | #84 | Exceptional 2.1% |
| Immigrants | Hungary | 99.6 /100 | #85 | Exceptional 2.1% |
| Asians | 99.6 /100 | #86 | Exceptional 2.1% |
| Lithuanians | 99.5 /100 | #87 | Exceptional 2.1% |
| Bhutanese | 99.5 /100 | #88 | Exceptional 2.1% |
| Immigrants | Armenia | 99.5 /100 | #89 | Exceptional 2.1% |
| Immigrants | Pakistan | 99.5 /100 | #90 | Exceptional 2.1% |
| Immigrants | Guyana | 99.4 /100 | #91 | Exceptional 2.1% |
| Romanians | 99.4 /100 | #92 | Exceptional 2.1% |
| Croatians | 99.3 /100 | #93 | Exceptional 2.1% |
| Ukrainians | 99.3 /100 | #94 | Exceptional 2.1% |
| Bermudans | 99.2 /100 | #95 | Exceptional 2.1% |
| Arabs | 99.2 /100 | #96 | Exceptional 2.1% |
| Immigrants | Moldova | 99.1 /100 | #97 | Exceptional 2.1% |
| Guyanese | 99.1 /100 | #98 | Exceptional 2.1% |