Northern European vs Immigrants from Colombia Births to Unmarried Women
COMPARE
Northern European
Immigrants from Colombia
Births to Unmarried Women
Births to Unmarried Women Comparison
Northern Europeans
Immigrants from Colombia
30.6%
BIRTHS TO UNMARRIED WOMEN
81.4/ 100
METRIC RATING
146th/ 347
METRIC RANK
32.6%
BIRTHS TO UNMARRIED WOMEN
21.7/ 100
METRIC RATING
196th/ 347
METRIC RANK
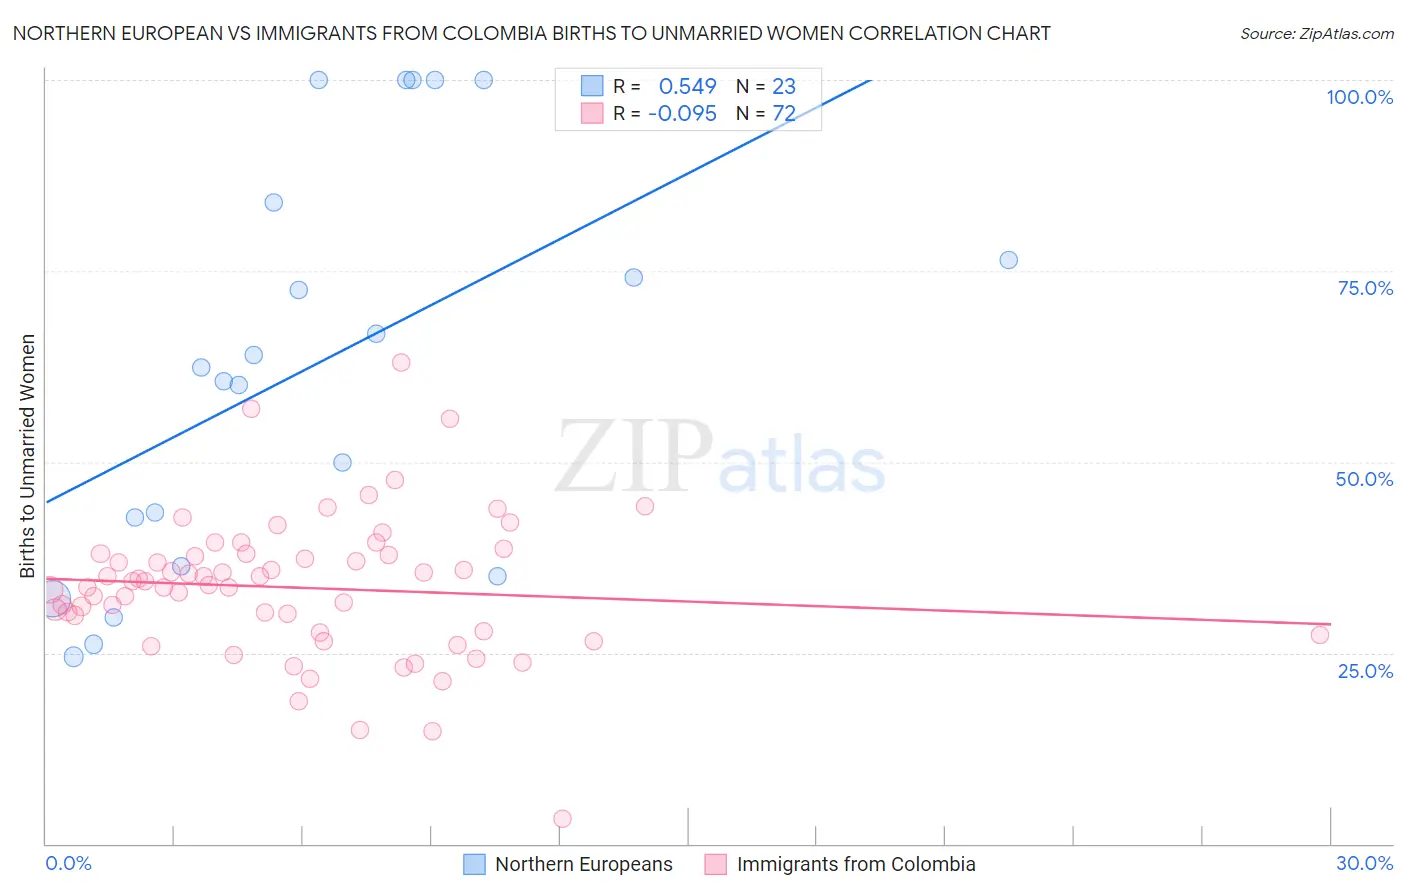
Northern European vs Immigrants from Colombia Births to Unmarried Women Correlation Chart
The statistical analysis conducted on geographies consisting of 374,226,135 people shows a substantial positive correlation between the proportion of Northern Europeans and percentage of births to unmarried women in the United States with a correlation coefficient (R) of 0.549 and weighted average of 30.6%. Similarly, the statistical analysis conducted on geographies consisting of 355,596,332 people shows a slight negative correlation between the proportion of Immigrants from Colombia and percentage of births to unmarried women in the United States with a correlation coefficient (R) of -0.095 and weighted average of 32.6%, a difference of 6.8%.
Births to Unmarried Women Correlation Summary
| Measurement | Northern European | Immigrants from Colombia |
| Minimum | 24.5% | 3.3% |
| Maximum | 100.0% | 63.1% |
| Range | 75.5% | 59.8% |
| Mean | 62.6% | 33.5% |
| Median | 62.3% | 34.1% |
| Interquartile 25% (IQ1) | 36.3% | 27.8% |
| Interquartile 75% (IQ3) | 83.9% | 37.9% |
| Interquartile Range (IQR) | 47.6% | 10.1% |
| Standard Deviation (Sample) | 26.2% | 9.4% |
| Standard Deviation (Population) | 25.6% | 9.3% |
Similar Demographics by Births to Unmarried Women
Demographics Similar to Northern Europeans by Births to Unmarried Women
In terms of births to unmarried women, the demographic groups most similar to Northern Europeans are Immigrants from North America (30.6%, a difference of 0.030%), Immigrants from Oceania (30.6%, a difference of 0.030%), Czech (30.5%, a difference of 0.13%), Immigrants from Uganda (30.5%, a difference of 0.20%), and South African (30.5%, a difference of 0.22%).
| Demographics | Rating | Rank | Births to Unmarried Women |
| Immigrants | Canada | 83.7 /100 | #139 | Excellent 30.4% |
| Swiss | 83.1 /100 | #140 | Excellent 30.5% |
| Pakistanis | 83.0 /100 | #141 | Excellent 30.5% |
| South Africans | 82.7 /100 | #142 | Excellent 30.5% |
| Immigrants | Uganda | 82.6 /100 | #143 | Excellent 30.5% |
| Czechs | 82.1 /100 | #144 | Excellent 30.5% |
| Immigrants | North America | 81.5 /100 | #145 | Excellent 30.6% |
| Northern Europeans | 81.4 /100 | #146 | Excellent 30.6% |
| Immigrants | Oceania | 81.2 /100 | #147 | Excellent 30.6% |
| Chileans | 79.1 /100 | #148 | Good 30.7% |
| Serbians | 78.8 /100 | #149 | Good 30.7% |
| Somalis | 77.8 /100 | #150 | Good 30.7% |
| Italians | 77.0 /100 | #151 | Good 30.8% |
| Poles | 76.2 /100 | #152 | Good 30.8% |
| British | 76.0 /100 | #153 | Good 30.8% |
Demographics Similar to Immigrants from Colombia by Births to Unmarried Women
In terms of births to unmarried women, the demographic groups most similar to Immigrants from Colombia are Samoan (32.6%, a difference of 0.030%), Immigrants (32.7%, a difference of 0.15%), Costa Rican (32.7%, a difference of 0.20%), Immigrants from Thailand (32.8%, a difference of 0.40%), and Immigrants from Germany (32.8%, a difference of 0.42%).
| Demographics | Rating | Rank | Births to Unmarried Women |
| Immigrants | Kenya | 36.9 /100 | #189 | Fair 32.1% |
| Tlingit-Haida | 32.6 /100 | #190 | Fair 32.2% |
| Irish | 32.4 /100 | #191 | Fair 32.2% |
| Colombians | 31.9 /100 | #192 | Fair 32.2% |
| Fijians | 31.1 /100 | #193 | Fair 32.3% |
| Sudanese | 27.3 /100 | #194 | Fair 32.4% |
| Samoans | 21.9 /100 | #195 | Fair 32.6% |
| Immigrants | Colombia | 21.7 /100 | #196 | Fair 32.6% |
| Immigrants | Immigrants | 20.6 /100 | #197 | Fair 32.7% |
| Costa Ricans | 20.3 /100 | #198 | Fair 32.7% |
| Immigrants | Thailand | 18.9 /100 | #199 | Poor 32.8% |
| Immigrants | Germany | 18.8 /100 | #200 | Poor 32.8% |
| Immigrants | Burma/Myanmar | 16.7 /100 | #201 | Poor 32.9% |
| Immigrants | Micronesia | 16.6 /100 | #202 | Poor 32.9% |
| Ute | 14.4 /100 | #203 | Poor 33.0% |