British vs Carpatho Rusyn Births to Unmarried Women
COMPARE
British
Carpatho Rusyn
Births to Unmarried Women
Births to Unmarried Women Comparison
British
Carpatho Rusyns
30.8%
BIRTHS TO UNMARRIED WOMEN
76.0/ 100
METRIC RATING
153rd/ 347
METRIC RANK
30.9%
BIRTHS TO UNMARRIED WOMEN
73.5/ 100
METRIC RATING
156th/ 347
METRIC RANK
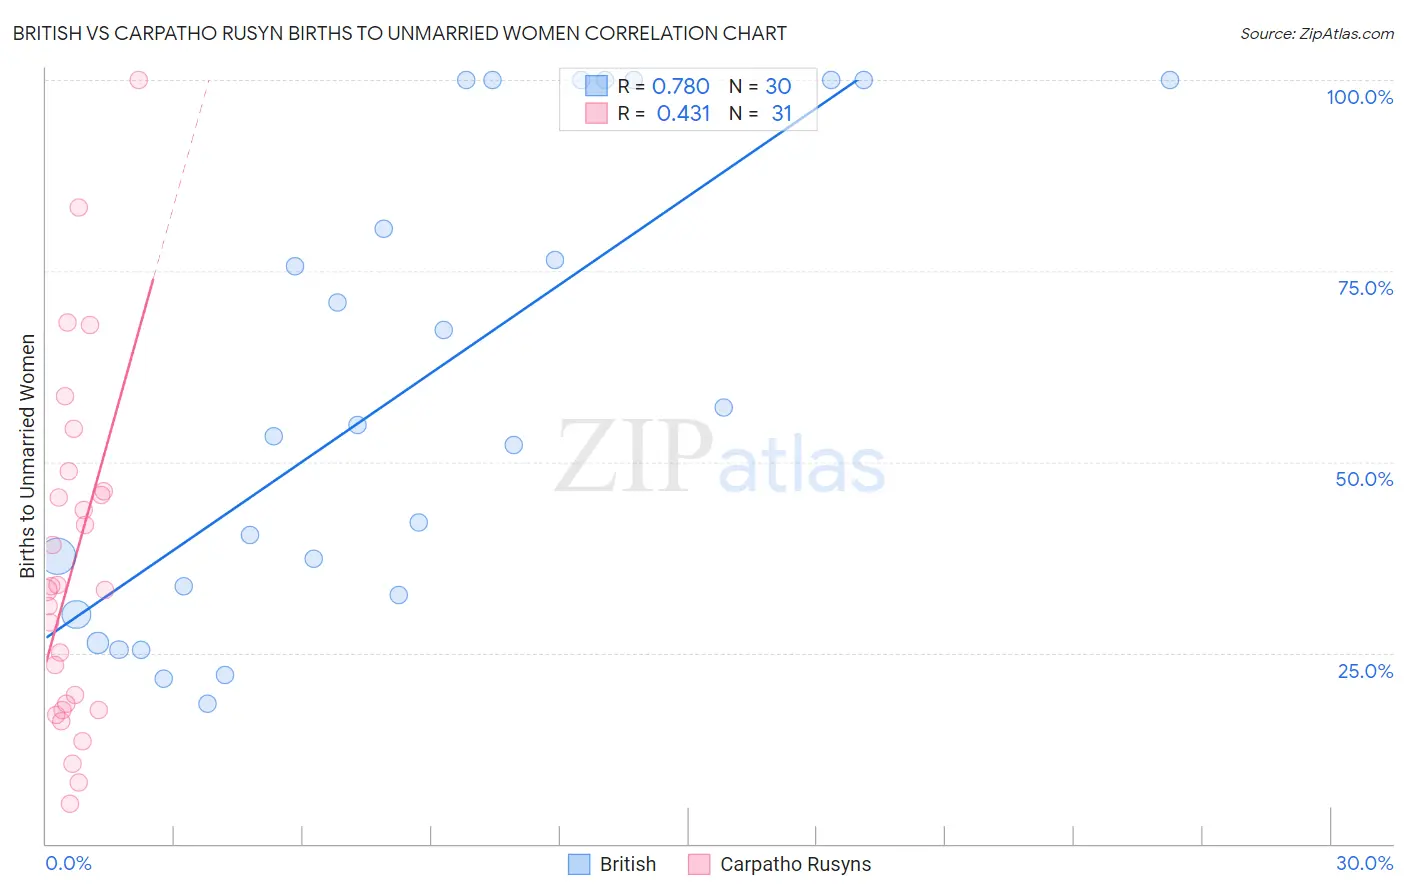
British vs Carpatho Rusyn Births to Unmarried Women Correlation Chart
The statistical analysis conducted on geographies consisting of 478,658,023 people shows a strong positive correlation between the proportion of British and percentage of births to unmarried women in the United States with a correlation coefficient (R) of 0.780 and weighted average of 30.8%. Similarly, the statistical analysis conducted on geographies consisting of 56,982,210 people shows a moderate positive correlation between the proportion of Carpatho Rusyns and percentage of births to unmarried women in the United States with a correlation coefficient (R) of 0.431 and weighted average of 30.9%, a difference of 0.32%.
Births to Unmarried Women Correlation Summary
| Measurement | British | Carpatho Rusyn |
| Minimum | 18.3% | 5.2% |
| Maximum | 100.0% | 100.0% |
| Range | 81.7% | 94.8% |
| Mean | 59.4% | 36.4% |
| Median | 54.1% | 33.3% |
| Interquartile 25% (IQ1) | 32.5% | 17.5% |
| Interquartile 75% (IQ3) | 100.0% | 46.2% |
| Interquartile Range (IQR) | 67.5% | 28.7% |
| Standard Deviation (Sample) | 30.1% | 22.4% |
| Standard Deviation (Population) | 29.6% | 22.1% |
Demographics Similar to British and Carpatho Rusyns by Births to Unmarried Women
In terms of births to unmarried women, the demographic groups most similar to British are Polish (30.8%, a difference of 0.020%), Yugoslavian (30.8%, a difference of 0.12%), Italian (30.8%, a difference of 0.13%), Somali (30.7%, a difference of 0.24%), and Immigrants from Bangladesh (30.9%, a difference of 0.27%). Similarly, the demographic groups most similar to Carpatho Rusyns are Immigrants from Bangladesh (30.9%, a difference of 0.050%), Immigrants from Eastern Africa (31.0%, a difference of 0.17%), Yugoslavian (30.8%, a difference of 0.20%), Polish (30.8%, a difference of 0.34%), and Austrian (31.0%, a difference of 0.44%).
| Demographics | Rating | Rank | Births to Unmarried Women |
| Czechs | 82.1 /100 | #144 | Excellent 30.5% |
| Immigrants | North America | 81.5 /100 | #145 | Excellent 30.6% |
| Northern Europeans | 81.4 /100 | #146 | Excellent 30.6% |
| Immigrants | Oceania | 81.2 /100 | #147 | Excellent 30.6% |
| Chileans | 79.1 /100 | #148 | Good 30.7% |
| Serbians | 78.8 /100 | #149 | Good 30.7% |
| Somalis | 77.8 /100 | #150 | Good 30.7% |
| Italians | 77.0 /100 | #151 | Good 30.8% |
| Poles | 76.2 /100 | #152 | Good 30.8% |
| British | 76.0 /100 | #153 | Good 30.8% |
| Yugoslavians | 75.1 /100 | #154 | Good 30.8% |
| Immigrants | Bangladesh | 73.9 /100 | #155 | Good 30.9% |
| Carpatho Rusyns | 73.5 /100 | #156 | Good 30.9% |
| Immigrants | Eastern Africa | 72.1 /100 | #157 | Good 31.0% |
| Austrians | 69.9 /100 | #158 | Good 31.0% |
| Immigrants | England | 69.4 /100 | #159 | Good 31.1% |
| Immigrants | Western Europe | 69.3 /100 | #160 | Good 31.1% |
| Immigrants | Southern Europe | 68.7 /100 | #161 | Good 31.1% |
| Slovenes | 65.9 /100 | #162 | Good 31.2% |
| Immigrants | Chile | 65.7 /100 | #163 | Good 31.2% |
| Hungarians | 64.1 /100 | #164 | Good 31.2% |