Filipino vs Sierra Leonean 3rd Grade
COMPARE
Filipino
Sierra Leonean
3rd Grade
3rd Grade Comparison
Filipinos
Sierra Leoneans
97.9%
3RD GRADE
79.9/ 100
METRIC RATING
143rd/ 347
METRIC RANK
97.5%
3RD GRADE
4.6/ 100
METRIC RATING
222nd/ 347
METRIC RANK
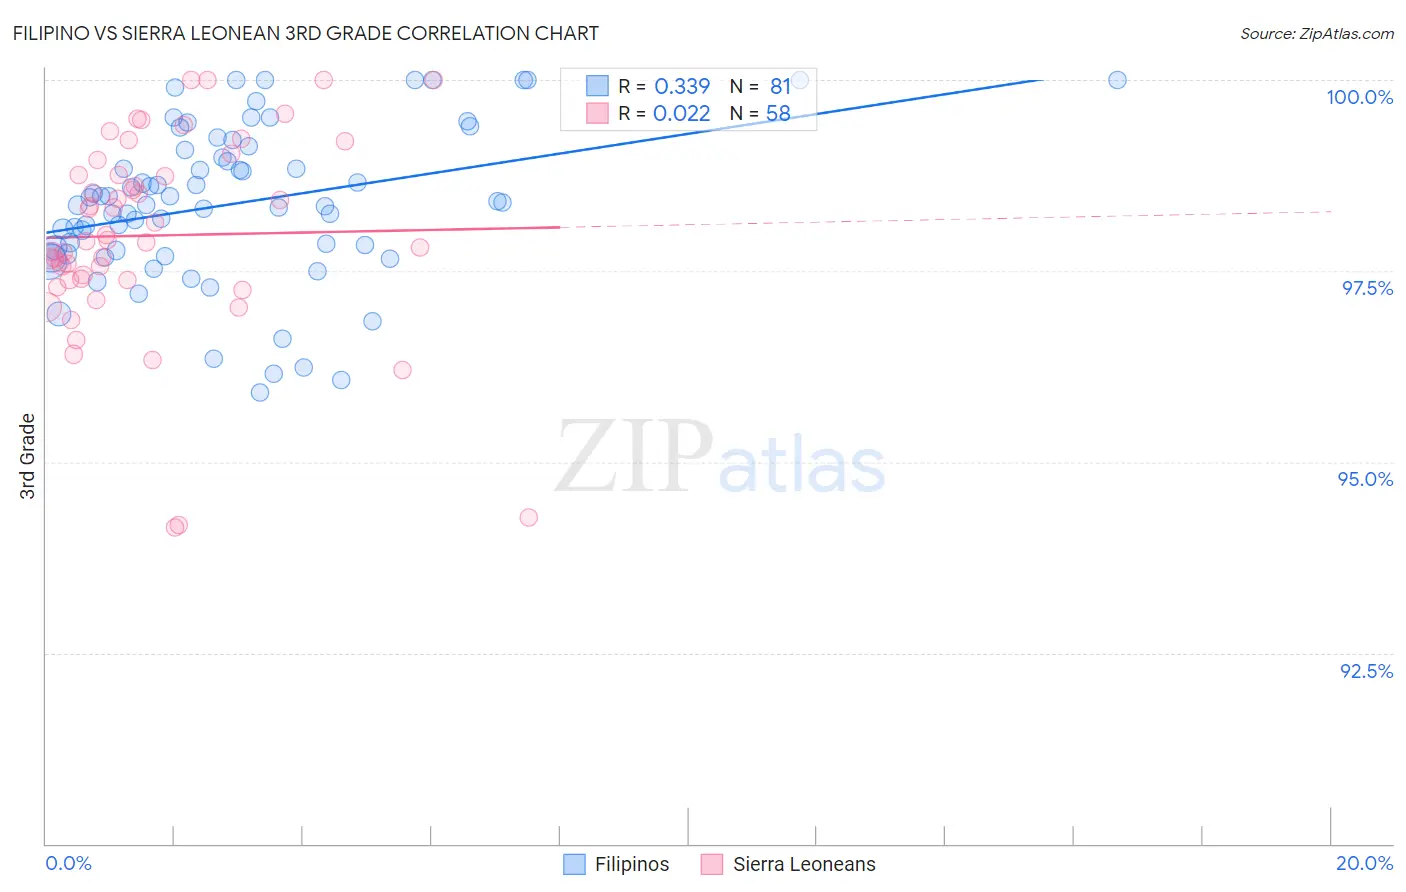
Filipino vs Sierra Leonean 3rd Grade Correlation Chart
The statistical analysis conducted on geographies consisting of 254,351,427 people shows a mild positive correlation between the proportion of Filipinos and percentage of population with at least 3rd grade education in the United States with a correlation coefficient (R) of 0.339 and weighted average of 97.9%. Similarly, the statistical analysis conducted on geographies consisting of 83,337,655 people shows no correlation between the proportion of Sierra Leoneans and percentage of population with at least 3rd grade education in the United States with a correlation coefficient (R) of 0.022 and weighted average of 97.5%, a difference of 0.37%.
3rd Grade Correlation Summary
| Measurement | Filipino | Sierra Leonean |
| Minimum | 95.9% | 94.1% |
| Maximum | 100.0% | 100.0% |
| Range | 4.1% | 5.9% |
| Mean | 98.4% | 98.0% |
| Median | 98.4% | 97.9% |
| Interquartile 25% (IQ1) | 97.7% | 97.4% |
| Interquartile 75% (IQ3) | 99.1% | 98.8% |
| Interquartile Range (IQR) | 1.4% | 1.4% |
| Standard Deviation (Sample) | 1.0% | 1.3% |
| Standard Deviation (Population) | 1.0% | 1.3% |
Similar Demographics by 3rd Grade
Demographics Similar to Filipinos by 3rd Grade
In terms of 3rd grade, the demographic groups most similar to Filipinos are Hmong (97.9%, a difference of 0.0%), Burmese (97.9%, a difference of 0.0%), Immigrants from Greece (97.9%, a difference of 0.0%), Alsatian (97.9%, a difference of 0.010%), and Immigrants from Israel (97.9%, a difference of 0.010%).
| Demographics | Rating | Rank | 3rd Grade |
| Spaniards | 87.9 /100 | #136 | Excellent 97.9% |
| Immigrants | Romania | 87.9 /100 | #137 | Excellent 97.9% |
| Israelis | 86.6 /100 | #138 | Excellent 97.9% |
| Blackfeet | 86.3 /100 | #139 | Excellent 97.9% |
| Palestinians | 84.6 /100 | #140 | Excellent 97.9% |
| Immigrants | Turkey | 83.5 /100 | #141 | Excellent 97.9% |
| Hmong | 80.3 /100 | #142 | Excellent 97.9% |
| Filipinos | 79.9 /100 | #143 | Good 97.9% |
| Burmese | 79.6 /100 | #144 | Good 97.9% |
| Immigrants | Greece | 79.5 /100 | #145 | Good 97.9% |
| Alsatians | 78.3 /100 | #146 | Good 97.9% |
| Immigrants | Israel | 77.3 /100 | #147 | Good 97.9% |
| Immigrants | Moldova | 77.1 /100 | #148 | Good 97.9% |
| Immigrants | North Macedonia | 74.5 /100 | #149 | Good 97.8% |
| Jordanians | 74.5 /100 | #150 | Good 97.8% |
Demographics Similar to Sierra Leoneans by 3rd Grade
In terms of 3rd grade, the demographic groups most similar to Sierra Leoneans are Immigrants from Syria (97.5%, a difference of 0.0%), Bahamian (97.5%, a difference of 0.0%), Tongan (97.5%, a difference of 0.0%), Immigrants from Nepal (97.5%, a difference of 0.010%), and Immigrants from Panama (97.5%, a difference of 0.010%).
| Demographics | Rating | Rank | 3rd Grade |
| Iraqis | 6.9 /100 | #215 | Tragic 97.5% |
| Samoans | 6.9 /100 | #216 | Tragic 97.5% |
| South American Indians | 5.7 /100 | #217 | Tragic 97.5% |
| Immigrants | Nepal | 5.3 /100 | #218 | Tragic 97.5% |
| Immigrants | Panama | 5.2 /100 | #219 | Tragic 97.5% |
| Immigrants | Morocco | 5.0 /100 | #220 | Tragic 97.5% |
| Uruguayans | 5.0 /100 | #221 | Tragic 97.5% |
| Sierra Leoneans | 4.6 /100 | #222 | Tragic 97.5% |
| Immigrants | Syria | 4.4 /100 | #223 | Tragic 97.5% |
| Bahamians | 4.4 /100 | #224 | Tragic 97.5% |
| Tongans | 4.3 /100 | #225 | Tragic 97.5% |
| Sudanese | 4.1 /100 | #226 | Tragic 97.5% |
| Immigrants | Sudan | 3.4 /100 | #227 | Tragic 97.5% |
| Sub-Saharan Africans | 3.2 /100 | #228 | Tragic 97.5% |
| Senegalese | 3.0 /100 | #229 | Tragic 97.5% |