Immigrants from Eastern Europe vs Sierra Leonean Single Father Households
COMPARE
Immigrants from Eastern Europe
Sierra Leonean
Single Father Households
Single Father Households Comparison
Immigrants from Eastern Europe
Sierra Leoneans
2.0%
SINGLE FATHER HOUSEHOLDS
100.0/ 100
METRIC RATING
38th/ 347
METRIC RANK
2.5%
SINGLE FATHER HOUSEHOLDS
5.9/ 100
METRIC RATING
237th/ 347
METRIC RANK
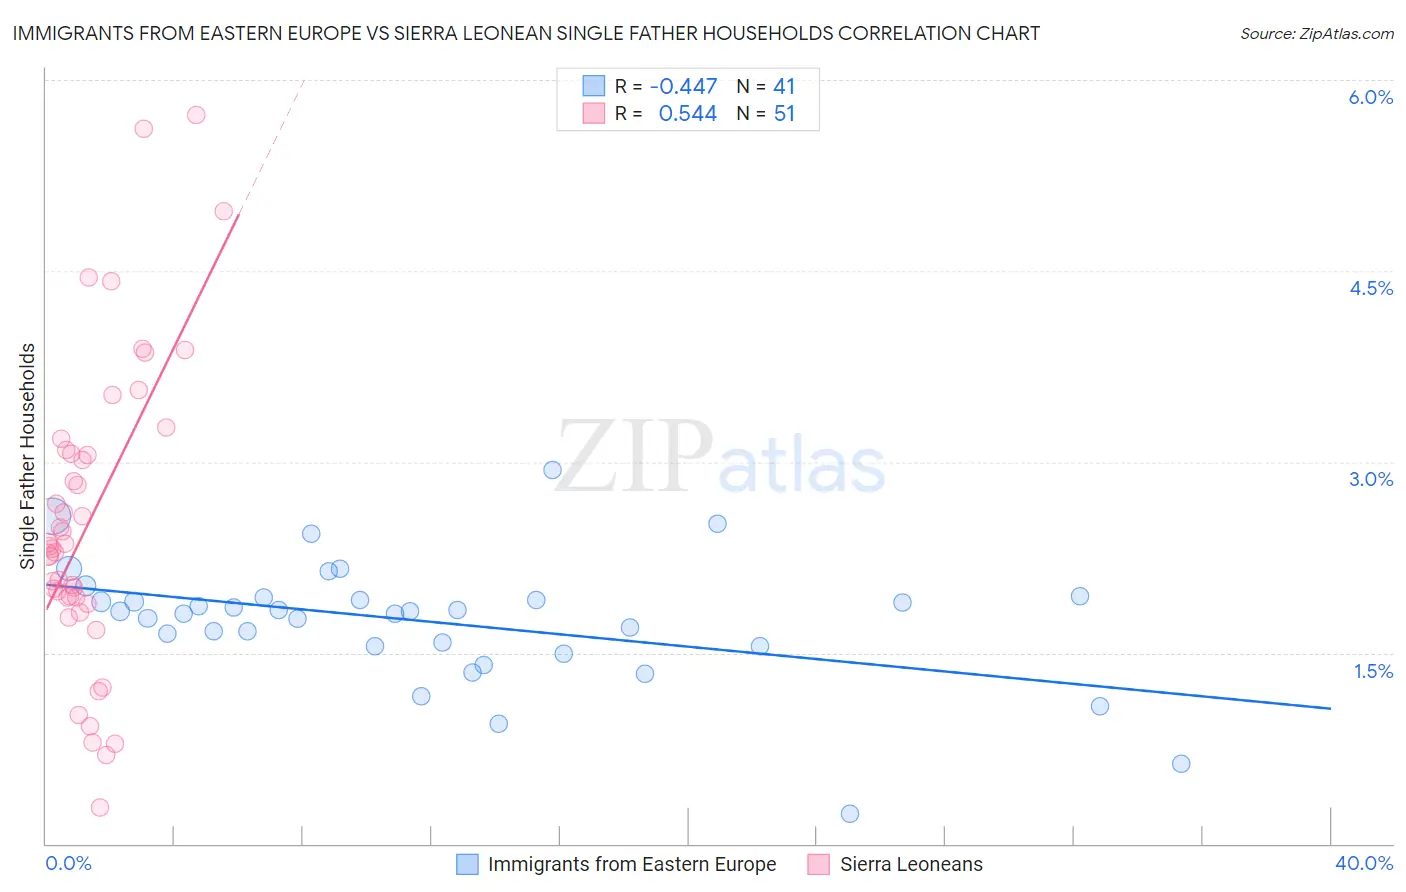
Immigrants from Eastern Europe vs Sierra Leonean Single Father Households Correlation Chart
The statistical analysis conducted on geographies consisting of 469,396,556 people shows a moderate negative correlation between the proportion of Immigrants from Eastern Europe and percentage of single father households in the United States with a correlation coefficient (R) of -0.447 and weighted average of 2.0%. Similarly, the statistical analysis conducted on geographies consisting of 83,228,063 people shows a substantial positive correlation between the proportion of Sierra Leoneans and percentage of single father households in the United States with a correlation coefficient (R) of 0.544 and weighted average of 2.5%, a difference of 23.4%.
Single Father Households Correlation Summary
| Measurement | Immigrants from Eastern Europe | Sierra Leonean |
| Minimum | 0.23% | 0.29% |
| Maximum | 2.9% | 5.7% |
| Range | 2.7% | 5.4% |
| Mean | 1.7% | 2.5% |
| Median | 1.8% | 2.3% |
| Interquartile 25% (IQ1) | 1.6% | 1.9% |
| Interquartile 75% (IQ3) | 1.9% | 3.1% |
| Interquartile Range (IQR) | 0.37% | 1.2% |
| Standard Deviation (Sample) | 0.49% | 1.2% |
| Standard Deviation (Population) | 0.48% | 1.2% |
Similar Demographics by Single Father Households
Demographics Similar to Immigrants from Eastern Europe by Single Father Households
In terms of single father households, the demographic groups most similar to Immigrants from Eastern Europe are Immigrants from Sri Lanka (2.0%, a difference of 0.0%), Immigrants from Bulgaria (2.0%, a difference of 0.050%), Immigrants from Turkey (2.0%, a difference of 0.23%), Immigrants from St. Vincent and the Grenadines (2.0%, a difference of 0.30%), and Immigrants from Belgium (2.0%, a difference of 0.32%).
| Demographics | Rating | Rank | Single Father Households |
| Israelis | 100.0 /100 | #31 | Exceptional 2.0% |
| Chinese | 100.0 /100 | #32 | Exceptional 2.0% |
| Turks | 100.0 /100 | #33 | Exceptional 2.0% |
| Immigrants | Australia | 100.0 /100 | #34 | Exceptional 2.0% |
| Albanians | 100.0 /100 | #35 | Exceptional 2.0% |
| Immigrants | Belgium | 100.0 /100 | #36 | Exceptional 2.0% |
| Immigrants | St. Vincent and the Grenadines | 100.0 /100 | #37 | Exceptional 2.0% |
| Immigrants | Eastern Europe | 100.0 /100 | #38 | Exceptional 2.0% |
| Immigrants | Sri Lanka | 100.0 /100 | #39 | Exceptional 2.0% |
| Immigrants | Bulgaria | 100.0 /100 | #40 | Exceptional 2.0% |
| Immigrants | Turkey | 100.0 /100 | #41 | Exceptional 2.0% |
| Macedonians | 100.0 /100 | #42 | Exceptional 2.0% |
| Immigrants | Grenada | 100.0 /100 | #43 | Exceptional 2.0% |
| Latvians | 100.0 /100 | #44 | Exceptional 2.0% |
| Russians | 100.0 /100 | #45 | Exceptional 2.0% |
Demographics Similar to Sierra Leoneans by Single Father Households
In terms of single father households, the demographic groups most similar to Sierra Leoneans are Immigrants from Sierra Leone (2.5%, a difference of 0.030%), Immigrants from Oceania (2.5%, a difference of 0.040%), Cajun (2.5%, a difference of 0.050%), Immigrants (2.5%, a difference of 0.10%), and African (2.5%, a difference of 0.12%).
| Demographics | Rating | Rank | Single Father Households |
| Sub-Saharan Africans | 8.3 /100 | #230 | Tragic 2.4% |
| Immigrants | Nonimmigrants | 7.6 /100 | #231 | Tragic 2.4% |
| Pennsylvania Germans | 7.3 /100 | #232 | Tragic 2.4% |
| Immigrants | Western Africa | 7.0 /100 | #233 | Tragic 2.4% |
| Africans | 6.3 /100 | #234 | Tragic 2.5% |
| Immigrants | Immigrants | 6.3 /100 | #235 | Tragic 2.5% |
| Cajuns | 6.1 /100 | #236 | Tragic 2.5% |
| Sierra Leoneans | 5.9 /100 | #237 | Tragic 2.5% |
| Immigrants | Sierra Leone | 5.8 /100 | #238 | Tragic 2.5% |
| Immigrants | Oceania | 5.8 /100 | #239 | Tragic 2.5% |
| Immigrants | Dominica | 4.8 /100 | #240 | Tragic 2.5% |
| Portuguese | 4.1 /100 | #241 | Tragic 2.5% |
| Osage | 4.1 /100 | #242 | Tragic 2.5% |
| Spaniards | 3.1 /100 | #243 | Tragic 2.5% |
| Immigrants | Middle Africa | 2.8 /100 | #244 | Tragic 2.5% |