Filipino vs French Canadian Births to Unmarried Women
COMPARE
Filipino
French Canadian
Births to Unmarried Women
Births to Unmarried Women Comparison
Filipinos
French Canadians
23.0%
BIRTHS TO UNMARRIED WOMEN
100.0/ 100
METRIC RATING
3rd/ 347
METRIC RANK
34.4%
BIRTHS TO UNMARRIED WOMEN
2.5/ 100
METRIC RATING
232nd/ 347
METRIC RANK
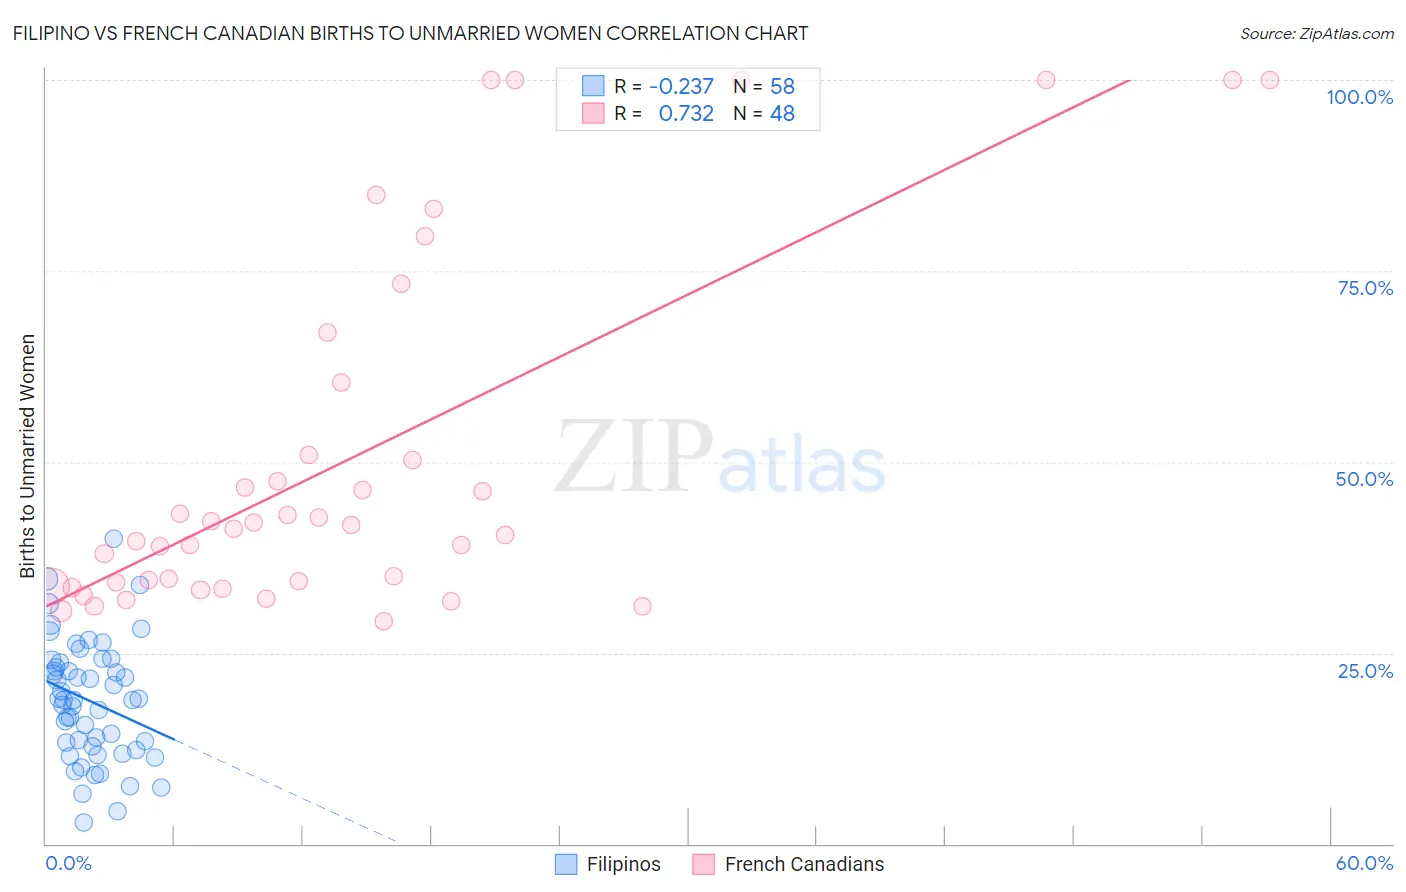
Filipino vs French Canadian Births to Unmarried Women Correlation Chart
The statistical analysis conducted on geographies consisting of 239,363,717 people shows a weak negative correlation between the proportion of Filipinos and percentage of births to unmarried women in the United States with a correlation coefficient (R) of -0.237 and weighted average of 23.0%. Similarly, the statistical analysis conducted on geographies consisting of 454,698,687 people shows a strong positive correlation between the proportion of French Canadians and percentage of births to unmarried women in the United States with a correlation coefficient (R) of 0.732 and weighted average of 34.4%, a difference of 49.7%.
Births to Unmarried Women Correlation Summary
| Measurement | Filipino | French Canadian |
| Minimum | 2.8% | 29.1% |
| Maximum | 40.0% | 100.0% |
| Range | 37.2% | 70.9% |
| Mean | 18.7% | 50.5% |
| Median | 18.9% | 41.5% |
| Interquartile 25% (IQ1) | 12.7% | 33.9% |
| Interquartile 75% (IQ3) | 23.7% | 55.6% |
| Interquartile Range (IQR) | 11.0% | 21.7% |
| Standard Deviation (Sample) | 7.8% | 23.2% |
| Standard Deviation (Population) | 7.7% | 23.0% |
Similar Demographics by Births to Unmarried Women
Demographics Similar to Filipinos by Births to Unmarried Women
In terms of births to unmarried women, the demographic groups most similar to Filipinos are Immigrants from Taiwan (23.0%, a difference of 0.14%), Immigrants from India (22.9%, a difference of 0.38%), Immigrants from Hong Kong (23.6%, a difference of 2.6%), Immigrants from Iran (24.0%, a difference of 4.3%), and Thai (24.0%, a difference of 4.6%).
| Demographics | Rating | Rank | Births to Unmarried Women |
| Assyrians/Chaldeans/Syriacs | 100.0 /100 | #1 | Exceptional 22.0% |
| Immigrants | India | 100.0 /100 | #2 | Exceptional 22.9% |
| Filipinos | 100.0 /100 | #3 | Exceptional 23.0% |
| Immigrants | Taiwan | 100.0 /100 | #4 | Exceptional 23.0% |
| Immigrants | Hong Kong | 100.0 /100 | #5 | Exceptional 23.6% |
| Immigrants | Iran | 100.0 /100 | #6 | Exceptional 24.0% |
| Thais | 100.0 /100 | #7 | Exceptional 24.0% |
| Immigrants | China | 100.0 /100 | #8 | Exceptional 24.7% |
| Immigrants | South Central Asia | 100.0 /100 | #9 | Exceptional 24.7% |
| Immigrants | Eastern Asia | 100.0 /100 | #10 | Exceptional 25.0% |
| Immigrants | Israel | 100.0 /100 | #11 | Exceptional 25.1% |
| Indians (Asian) | 100.0 /100 | #12 | Exceptional 25.3% |
| Iranians | 100.0 /100 | #13 | Exceptional 25.3% |
| Immigrants | Lebanon | 100.0 /100 | #14 | Exceptional 25.3% |
| Immigrants | Singapore | 100.0 /100 | #15 | Exceptional 25.6% |
Demographics Similar to French Canadians by Births to Unmarried Women
In terms of births to unmarried women, the demographic groups most similar to French Canadians are Bangladeshi (34.4%, a difference of 0.020%), Immigrants from Zaire (34.5%, a difference of 0.26%), Native Hawaiian (34.3%, a difference of 0.30%), Immigrants from Ghana (34.5%, a difference of 0.33%), and Ghanaian (34.3%, a difference of 0.44%).
| Demographics | Rating | Rank | Births to Unmarried Women |
| Spanish | 4.0 /100 | #225 | Tragic 34.1% |
| Delaware | 3.3 /100 | #226 | Tragic 34.2% |
| Immigrants | Panama | 3.3 /100 | #227 | Tragic 34.2% |
| Panamanians | 3.3 /100 | #228 | Tragic 34.2% |
| Immigrants | Sierra Leone | 3.1 /100 | #229 | Tragic 34.2% |
| Ghanaians | 3.1 /100 | #230 | Tragic 34.3% |
| Native Hawaiians | 2.9 /100 | #231 | Tragic 34.3% |
| French Canadians | 2.5 /100 | #232 | Tragic 34.4% |
| Bangladeshis | 2.5 /100 | #233 | Tragic 34.4% |
| Immigrants | Zaire | 2.3 /100 | #234 | Tragic 34.5% |
| Immigrants | Ghana | 2.2 /100 | #235 | Tragic 34.5% |
| Immigrants | Cameroon | 1.6 /100 | #236 | Tragic 34.7% |
| Marshallese | 1.6 /100 | #237 | Tragic 34.8% |
| Immigrants | Cambodia | 1.6 /100 | #238 | Tragic 34.8% |
| Sierra Leoneans | 1.4 /100 | #239 | Tragic 34.9% |