Immigrants from Zaire vs Uruguayan Currently Married
COMPARE
Immigrants from Zaire
Uruguayan
Currently Married
Currently Married Comparison
Immigrants from Zaire
Uruguayans
42.0%
CURRENTLY MARRIED
0.0/ 100
METRIC RATING
302nd/ 347
METRIC RANK
45.6%
CURRENTLY MARRIED
7.9/ 100
METRIC RATING
210th/ 347
METRIC RANK
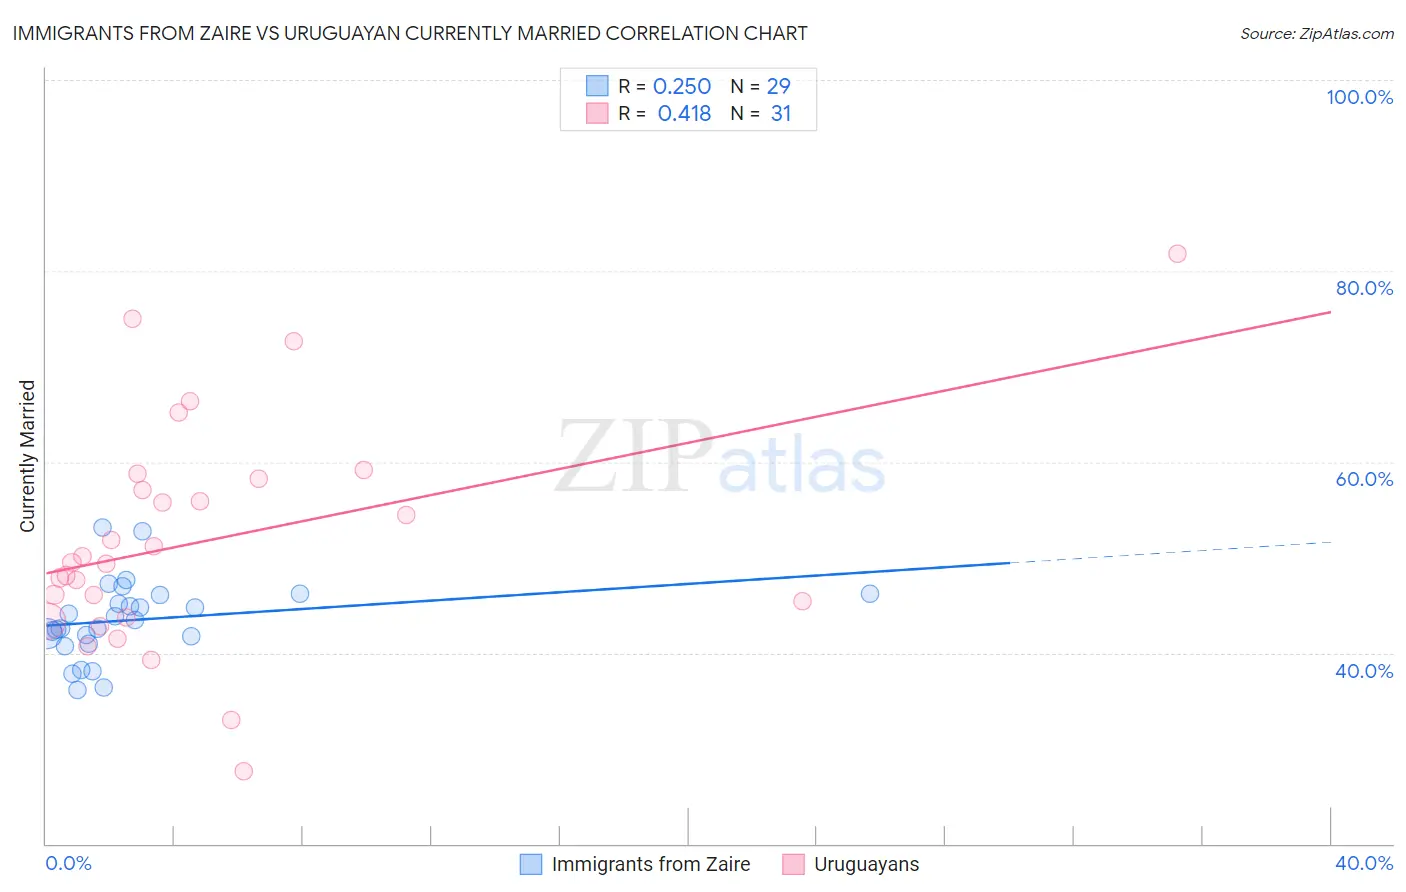
Immigrants from Zaire vs Uruguayan Currently Married Correlation Chart
The statistical analysis conducted on geographies consisting of 107,251,110 people shows a weak positive correlation between the proportion of Immigrants from Zaire and percentage of population currently married in the United States with a correlation coefficient (R) of 0.250 and weighted average of 42.0%. Similarly, the statistical analysis conducted on geographies consisting of 144,776,099 people shows a moderate positive correlation between the proportion of Uruguayans and percentage of population currently married in the United States with a correlation coefficient (R) of 0.418 and weighted average of 45.6%, a difference of 8.7%.
Currently Married Correlation Summary
| Measurement | Immigrants from Zaire | Uruguayan |
| Minimum | 36.1% | 27.6% |
| Maximum | 53.1% | 81.8% |
| Range | 16.9% | 54.2% |
| Mean | 43.5% | 51.8% |
| Median | 43.4% | 49.5% |
| Interquartile 25% (IQ1) | 41.4% | 43.7% |
| Interquartile 75% (IQ3) | 46.1% | 58.2% |
| Interquartile Range (IQR) | 4.8% | 14.6% |
| Standard Deviation (Sample) | 4.1% | 11.8% |
| Standard Deviation (Population) | 4.0% | 11.6% |
Similar Demographics by Currently Married
Demographics Similar to Immigrants from Zaire by Currently Married
In terms of currently married, the demographic groups most similar to Immigrants from Zaire are Sioux (41.9%, a difference of 0.010%), Immigrants from Bahamas (41.9%, a difference of 0.13%), Immigrants from Trinidad and Tobago (41.9%, a difference of 0.16%), Immigrants from Guyana (41.9%, a difference of 0.17%), and Immigrants from Yemen (42.1%, a difference of 0.25%).
| Demographics | Rating | Rank | Currently Married |
| Immigrants | Western Africa | 0.0 /100 | #295 | Tragic 42.4% |
| Menominee | 0.0 /100 | #296 | Tragic 42.3% |
| Cheyenne | 0.0 /100 | #297 | Tragic 42.2% |
| Immigrants | Honduras | 0.0 /100 | #298 | Tragic 42.2% |
| Liberians | 0.0 /100 | #299 | Tragic 42.2% |
| Belizeans | 0.0 /100 | #300 | Tragic 42.2% |
| Immigrants | Yemen | 0.0 /100 | #301 | Tragic 42.1% |
| Immigrants | Zaire | 0.0 /100 | #302 | Tragic 42.0% |
| Sioux | 0.0 /100 | #303 | Tragic 41.9% |
| Immigrants | Bahamas | 0.0 /100 | #304 | Tragic 41.9% |
| Immigrants | Trinidad and Tobago | 0.0 /100 | #305 | Tragic 41.9% |
| Immigrants | Guyana | 0.0 /100 | #306 | Tragic 41.9% |
| Africans | 0.0 /100 | #307 | Tragic 41.8% |
| Immigrants | Belize | 0.0 /100 | #308 | Tragic 41.8% |
| Immigrants | Liberia | 0.0 /100 | #309 | Tragic 41.8% |
Demographics Similar to Uruguayans by Currently Married
In terms of currently married, the demographic groups most similar to Uruguayans are Houma (45.5%, a difference of 0.090%), Marshallese (45.5%, a difference of 0.090%), Immigrants from Micronesia (45.6%, a difference of 0.11%), Alaska Native (45.5%, a difference of 0.12%), and Dutch West Indian (45.5%, a difference of 0.16%).
| Demographics | Rating | Rank | Currently Married |
| Taiwanese | 11.7 /100 | #203 | Poor 45.8% |
| Immigrants | Spain | 11.6 /100 | #204 | Poor 45.8% |
| South American Indians | 11.5 /100 | #205 | Poor 45.8% |
| Immigrants | Immigrants | 11.2 /100 | #206 | Poor 45.8% |
| Immigrants | South America | 10.8 /100 | #207 | Poor 45.7% |
| Alsatians | 10.8 /100 | #208 | Poor 45.7% |
| Immigrants | Micronesia | 8.8 /100 | #209 | Tragic 45.6% |
| Uruguayans | 7.9 /100 | #210 | Tragic 45.6% |
| Houma | 7.2 /100 | #211 | Tragic 45.5% |
| Marshallese | 7.2 /100 | #212 | Tragic 45.5% |
| Alaska Natives | 7.0 /100 | #213 | Tragic 45.5% |
| Dutch West Indians | 6.7 /100 | #214 | Tragic 45.5% |
| German Russians | 6.7 /100 | #215 | Tragic 45.5% |
| Immigrants | Morocco | 5.5 /100 | #216 | Tragic 45.4% |
| Immigrants | Thailand | 5.1 /100 | #217 | Tragic 45.4% |