European vs Immigrants from Spain Single Father Households
COMPARE
European
Immigrants from Spain
Single Father Households
Single Father Households Comparison
Europeans
Immigrants from Spain
2.3%
SINGLE FATHER HOUSEHOLDS
80.9/ 100
METRIC RATING
155th/ 347
METRIC RANK
2.1%
SINGLE FATHER HOUSEHOLDS
99.8/ 100
METRIC RATING
72nd/ 347
METRIC RANK
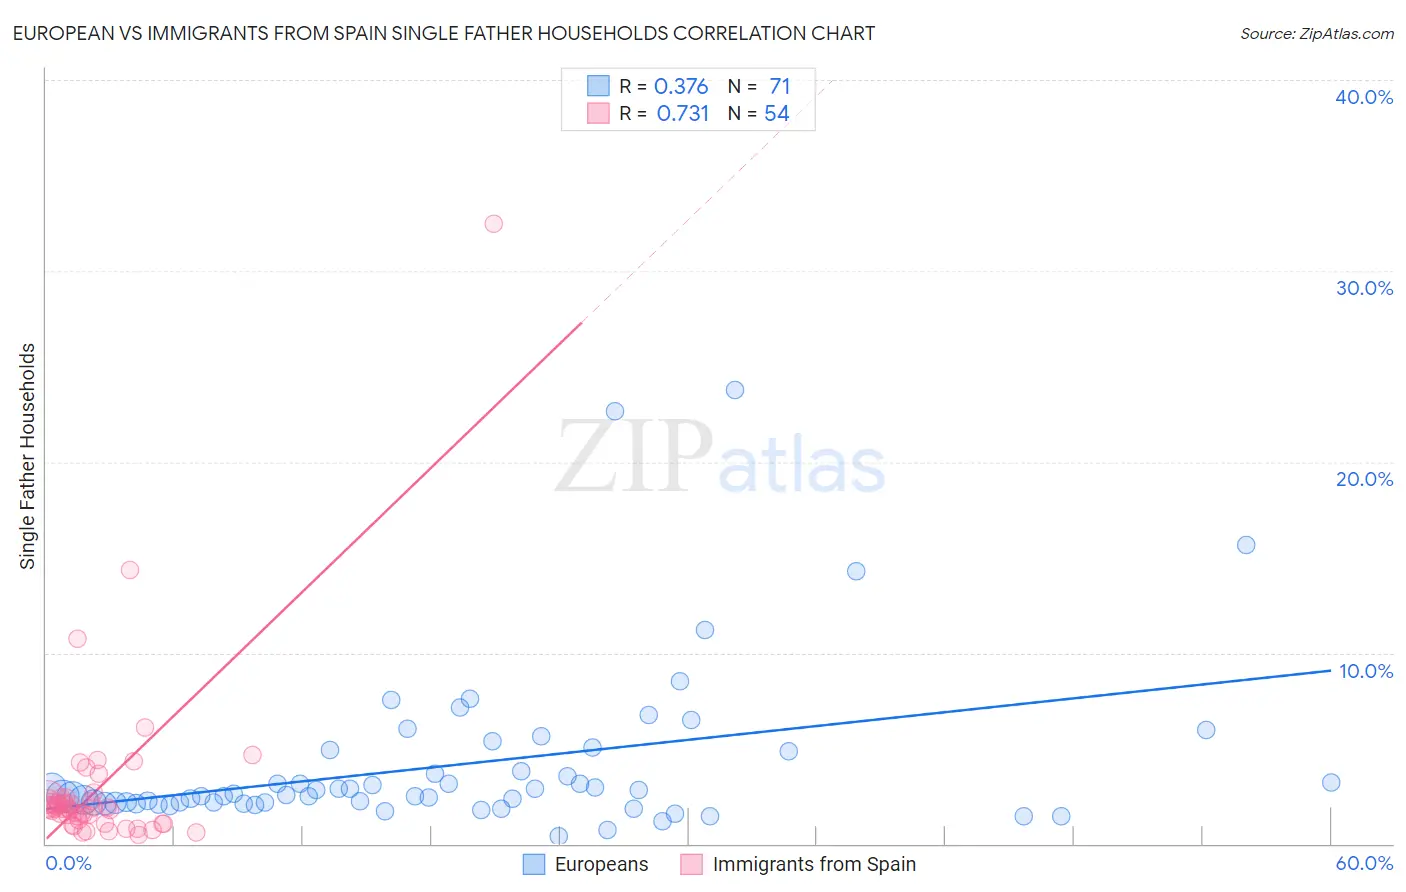
European vs Immigrants from Spain Single Father Households Correlation Chart
The statistical analysis conducted on geographies consisting of 548,404,075 people shows a mild positive correlation between the proportion of Europeans and percentage of single father households in the United States with a correlation coefficient (R) of 0.376 and weighted average of 2.3%. Similarly, the statistical analysis conducted on geographies consisting of 238,550,854 people shows a strong positive correlation between the proportion of Immigrants from Spain and percentage of single father households in the United States with a correlation coefficient (R) of 0.731 and weighted average of 2.1%, a difference of 10.1%.
Single Father Households Correlation Summary
| Measurement | European | Immigrants from Spain |
| Minimum | 0.42% | 0.45% |
| Maximum | 23.7% | 32.5% |
| Range | 23.3% | 32.0% |
| Mean | 4.1% | 2.9% |
| Median | 2.5% | 1.9% |
| Interquartile 25% (IQ1) | 2.1% | 1.3% |
| Interquartile 75% (IQ3) | 4.8% | 2.4% |
| Interquartile Range (IQR) | 2.7% | 1.1% |
| Standard Deviation (Sample) | 4.3% | 4.7% |
| Standard Deviation (Population) | 4.2% | 4.7% |
Similar Demographics by Single Father Households
Demographics Similar to Europeans by Single Father Households
In terms of single father households, the demographic groups most similar to Europeans are Bolivian (2.3%, a difference of 0.020%), Immigrants from South America (2.3%, a difference of 0.12%), Canadian (2.3%, a difference of 0.14%), Immigrants from Senegal (2.3%, a difference of 0.17%), and Immigrants from Germany (2.3%, a difference of 0.24%).
| Demographics | Rating | Rank | Single Father Households |
| South American Indians | 88.5 /100 | #148 | Excellent 2.3% |
| Senegalese | 88.4 /100 | #149 | Excellent 2.3% |
| Venezuelans | 86.2 /100 | #150 | Excellent 2.3% |
| Immigrants | Syria | 84.8 /100 | #151 | Excellent 2.3% |
| Immigrants | Venezuela | 83.2 /100 | #152 | Excellent 2.3% |
| Immigrants | Germany | 82.8 /100 | #153 | Excellent 2.3% |
| Bolivians | 81.0 /100 | #154 | Excellent 2.3% |
| Europeans | 80.9 /100 | #155 | Excellent 2.3% |
| Immigrants | South America | 79.9 /100 | #156 | Good 2.3% |
| Canadians | 79.7 /100 | #157 | Good 2.3% |
| Immigrants | Senegal | 79.4 /100 | #158 | Good 2.3% |
| Immigrants | West Indies | 77.9 /100 | #159 | Good 2.3% |
| Immigrants | Bolivia | 76.3 /100 | #160 | Good 2.3% |
| Swiss | 73.2 /100 | #161 | Good 2.3% |
| Scottish | 72.8 /100 | #162 | Good 2.3% |
Demographics Similar to Immigrants from Spain by Single Father Households
In terms of single father households, the demographic groups most similar to Immigrants from Spain are Immigrants from Kuwait (2.1%, a difference of 0.0%), Egyptian (2.1%, a difference of 0.020%), Immigrants from Bangladesh (2.1%, a difference of 0.14%), Immigrants from Egypt (2.1%, a difference of 0.15%), and Immigrants from Romania (2.1%, a difference of 0.22%).
| Demographics | Rating | Rank | Single Father Households |
| Paraguayans | 99.9 /100 | #65 | Exceptional 2.1% |
| Immigrants | Western Asia | 99.8 /100 | #66 | Exceptional 2.1% |
| Immigrants | Italy | 99.8 /100 | #67 | Exceptional 2.1% |
| Immigrants | Denmark | 99.8 /100 | #68 | Exceptional 2.1% |
| Immigrants | Romania | 99.8 /100 | #69 | Exceptional 2.1% |
| Egyptians | 99.8 /100 | #70 | Exceptional 2.1% |
| Immigrants | Kuwait | 99.8 /100 | #71 | Exceptional 2.1% |
| Immigrants | Spain | 99.8 /100 | #72 | Exceptional 2.1% |
| Immigrants | Bangladesh | 99.8 /100 | #73 | Exceptional 2.1% |
| Immigrants | Egypt | 99.8 /100 | #74 | Exceptional 2.1% |
| Immigrants | Sweden | 99.8 /100 | #75 | Exceptional 2.1% |
| Immigrants | Scotland | 99.8 /100 | #76 | Exceptional 2.1% |
| Immigrants | Saudi Arabia | 99.8 /100 | #77 | Exceptional 2.1% |
| Estonians | 99.7 /100 | #78 | Exceptional 2.1% |
| Immigrants | Asia | 99.7 /100 | #79 | Exceptional 2.1% |