Ethiopian vs Chippewa Single Mother Households
COMPARE
Ethiopian
Chippewa
Single Mother Households
Single Mother Households Comparison
Ethiopians
Chippewa
6.5%
SINGLE MOTHER HOUSEHOLDS
26.0/ 100
METRIC RATING
184th/ 347
METRIC RANK
8.0%
SINGLE MOTHER HOUSEHOLDS
0.0/ 100
METRIC RATING
301st/ 347
METRIC RANK
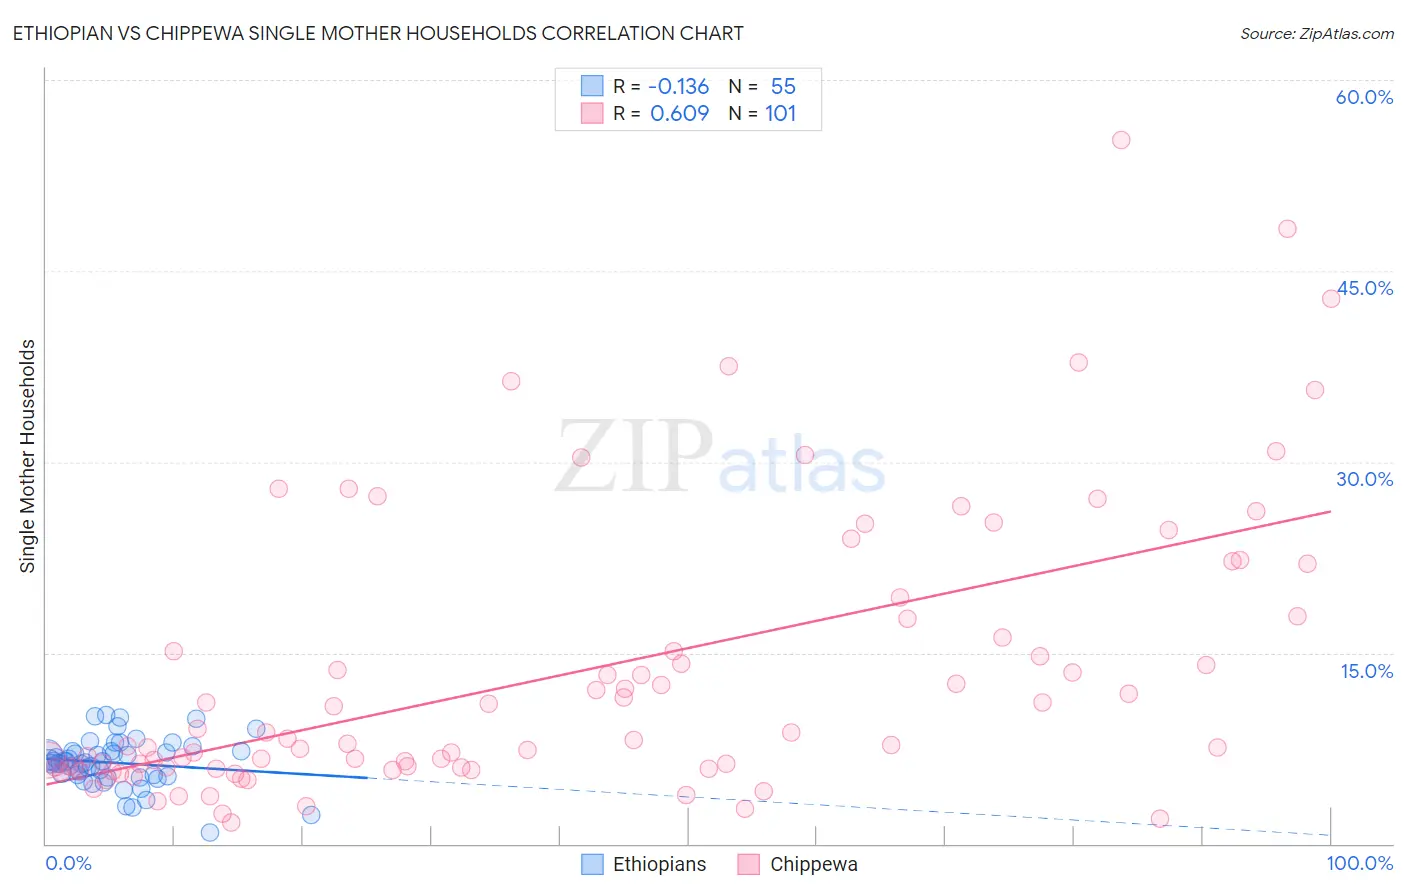
Ethiopian vs Chippewa Single Mother Households Correlation Chart
The statistical analysis conducted on geographies consisting of 222,859,722 people shows a poor negative correlation between the proportion of Ethiopians and percentage of single mother households in the United States with a correlation coefficient (R) of -0.136 and weighted average of 6.5%. Similarly, the statistical analysis conducted on geographies consisting of 214,662,896 people shows a significant positive correlation between the proportion of Chippewa and percentage of single mother households in the United States with a correlation coefficient (R) of 0.609 and weighted average of 8.0%, a difference of 22.9%.
Single Mother Households Correlation Summary
| Measurement | Ethiopian | Chippewa |
| Minimum | 0.92% | 1.7% |
| Maximum | 10.1% | 55.3% |
| Range | 9.2% | 53.6% |
| Mean | 6.4% | 13.4% |
| Median | 6.4% | 8.2% |
| Interquartile 25% (IQ1) | 5.3% | 6.0% |
| Interquartile 75% (IQ3) | 7.3% | 17.8% |
| Interquartile Range (IQR) | 2.0% | 11.8% |
| Standard Deviation (Sample) | 1.9% | 11.0% |
| Standard Deviation (Population) | 1.9% | 11.0% |
Similar Demographics by Single Mother Households
Demographics Similar to Ethiopians by Single Mother Households
In terms of single mother households, the demographic groups most similar to Ethiopians are Ugandan (6.5%, a difference of 0.060%), Costa Rican (6.5%, a difference of 0.17%), Immigrants from Afghanistan (6.5%, a difference of 0.19%), Spaniard (6.5%, a difference of 0.24%), and Ottawa (6.5%, a difference of 0.32%).
| Demographics | Rating | Rank | Single Mother Households |
| Osage | 43.0 /100 | #177 | Average 6.4% |
| Portuguese | 40.0 /100 | #178 | Fair 6.4% |
| Hmong | 39.8 /100 | #179 | Fair 6.4% |
| Immigrants | Nepal | 36.1 /100 | #180 | Fair 6.4% |
| Spanish | 33.4 /100 | #181 | Fair 6.4% |
| South American Indians | 33.4 /100 | #182 | Fair 6.4% |
| Spaniards | 27.8 /100 | #183 | Fair 6.5% |
| Ethiopians | 26.0 /100 | #184 | Fair 6.5% |
| Ugandans | 25.6 /100 | #185 | Fair 6.5% |
| Costa Ricans | 24.8 /100 | #186 | Fair 6.5% |
| Immigrants | Afghanistan | 24.7 /100 | #187 | Fair 6.5% |
| Ottawa | 23.8 /100 | #188 | Fair 6.5% |
| Delaware | 23.3 /100 | #189 | Fair 6.5% |
| Peruvians | 21.6 /100 | #190 | Fair 6.5% |
| Samoans | 21.2 /100 | #191 | Fair 6.5% |
Demographics Similar to Chippewa by Single Mother Households
In terms of single mother households, the demographic groups most similar to Chippewa are Immigrants from Ghana (8.0%, a difference of 0.10%), Immigrants from Bahamas (8.0%, a difference of 0.12%), Mexican (8.0%, a difference of 0.16%), Native/Alaskan (8.0%, a difference of 0.56%), and Colville (8.0%, a difference of 0.61%).
| Demographics | Rating | Rank | Single Mother Households |
| Apache | 0.0 /100 | #294 | Tragic 7.9% |
| Barbadians | 0.0 /100 | #295 | Tragic 7.9% |
| Immigrants | Latin America | 0.0 /100 | #296 | Tragic 7.9% |
| Hispanics or Latinos | 0.0 /100 | #297 | Tragic 7.9% |
| Immigrants | West Indies | 0.0 /100 | #298 | Tragic 7.9% |
| Houma | 0.0 /100 | #299 | Tragic 7.9% |
| Mexicans | 0.0 /100 | #300 | Tragic 8.0% |
| Chippewa | 0.0 /100 | #301 | Tragic 8.0% |
| Immigrants | Ghana | 0.0 /100 | #302 | Tragic 8.0% |
| Immigrants | Bahamas | 0.0 /100 | #303 | Tragic 8.0% |
| Natives/Alaskans | 0.0 /100 | #304 | Tragic 8.0% |
| Colville | 0.0 /100 | #305 | Tragic 8.0% |
| Immigrants | Barbados | 0.0 /100 | #306 | Tragic 8.0% |
| Immigrants | St. Vincent and the Grenadines | 0.0 /100 | #307 | Tragic 8.0% |
| Immigrants | Central America | 0.0 /100 | #308 | Tragic 8.1% |