English vs Immigrants from Moldova Currently Married
COMPARE
English
Immigrants from Moldova
Currently Married
Currently Married Comparison
English
Immigrants from Moldova
49.7%
CURRENTLY MARRIED
99.9/ 100
METRIC RATING
11th/ 347
METRIC RANK
48.5%
CURRENTLY MARRIED
98.7/ 100
METRIC RATING
54th/ 347
METRIC RANK
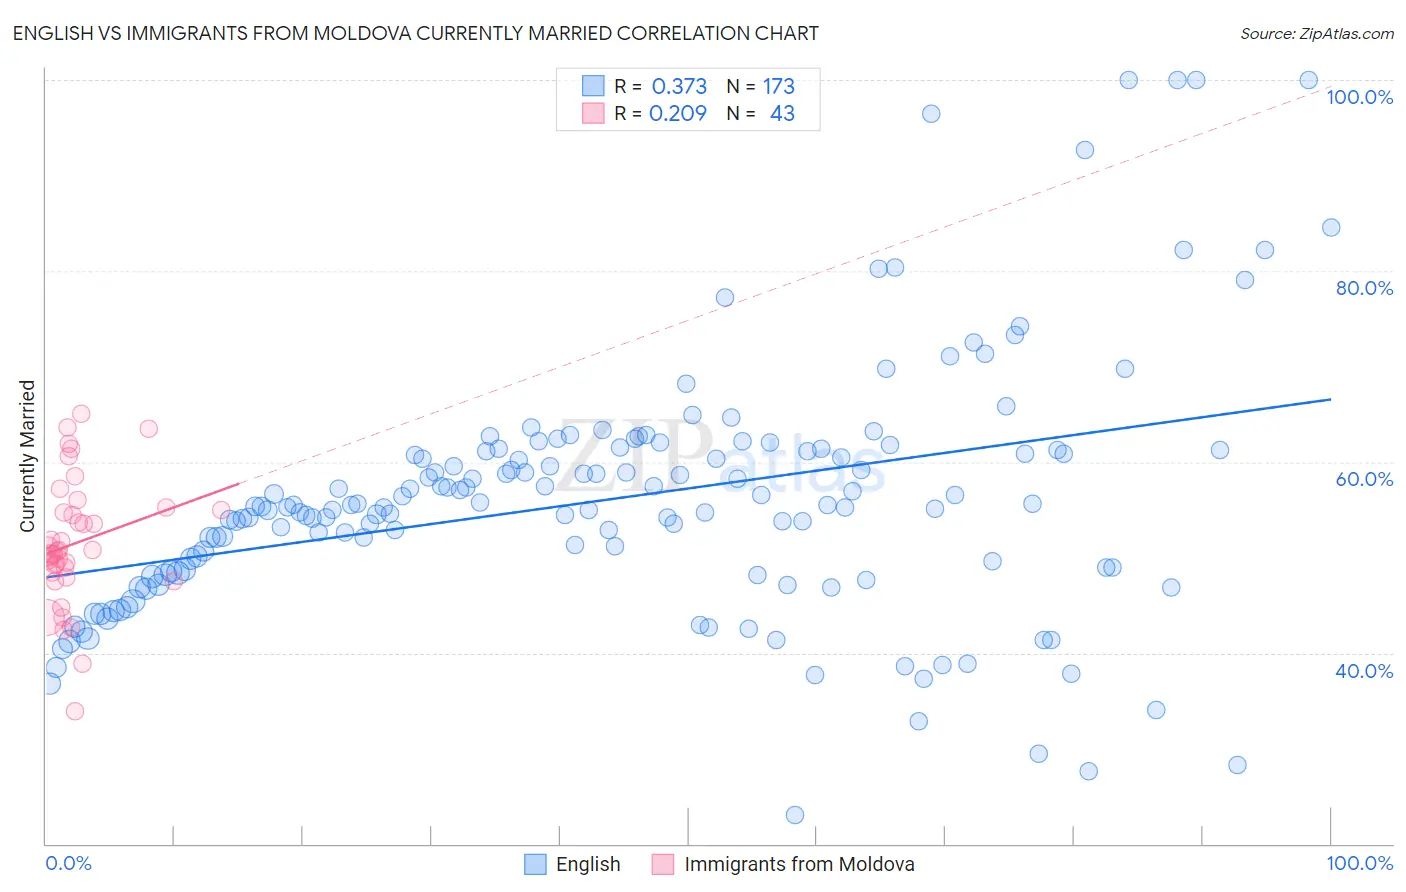
English vs Immigrants from Moldova Currently Married Correlation Chart
The statistical analysis conducted on geographies consisting of 579,833,471 people shows a mild positive correlation between the proportion of English and percentage of population currently married in the United States with a correlation coefficient (R) of 0.373 and weighted average of 49.7%. Similarly, the statistical analysis conducted on geographies consisting of 124,399,411 people shows a weak positive correlation between the proportion of Immigrants from Moldova and percentage of population currently married in the United States with a correlation coefficient (R) of 0.209 and weighted average of 48.5%, a difference of 2.6%.
Currently Married Correlation Summary
| Measurement | English | Immigrants from Moldova |
| Minimum | 23.0% | 33.9% |
| Maximum | 100.0% | 65.0% |
| Range | 77.0% | 31.1% |
| Mean | 56.1% | 51.5% |
| Median | 55.3% | 50.6% |
| Interquartile 25% (IQ1) | 48.4% | 48.4% |
| Interquartile 75% (IQ3) | 61.2% | 55.0% |
| Interquartile Range (IQR) | 12.7% | 6.6% |
| Standard Deviation (Sample) | 13.2% | 6.6% |
| Standard Deviation (Population) | 13.1% | 6.5% |
Similar Demographics by Currently Married
Demographics Similar to English by Currently Married
In terms of currently married, the demographic groups most similar to English are Swiss (49.7%, a difference of 0.0%), Filipino (49.7%, a difference of 0.010%), Dutch (49.6%, a difference of 0.26%), Czech (49.9%, a difference of 0.27%), and German (49.6%, a difference of 0.28%).
| Demographics | Rating | Rank | Currently Married |
| Immigrants | Taiwan | 100.0 /100 | #4 | Exceptional 50.7% |
| Danes | 100.0 /100 | #5 | Exceptional 50.5% |
| Norwegians | 100.0 /100 | #6 | Exceptional 50.2% |
| Immigrants | South Central Asia | 100.0 /100 | #7 | Exceptional 50.0% |
| Swedes | 100.0 /100 | #8 | Exceptional 50.0% |
| Czechs | 99.9 /100 | #9 | Exceptional 49.9% |
| Filipinos | 99.9 /100 | #10 | Exceptional 49.7% |
| English | 99.9 /100 | #11 | Exceptional 49.7% |
| Swiss | 99.9 /100 | #12 | Exceptional 49.7% |
| Dutch | 99.9 /100 | #13 | Exceptional 49.6% |
| Germans | 99.9 /100 | #14 | Exceptional 49.6% |
| Pennsylvania Germans | 99.9 /100 | #15 | Exceptional 49.6% |
| Chinese | 99.9 /100 | #16 | Exceptional 49.5% |
| Scandinavians | 99.9 /100 | #17 | Exceptional 49.5% |
| Immigrants | Scotland | 99.8 /100 | #18 | Exceptional 49.3% |
Demographics Similar to Immigrants from Moldova by Currently Married
In terms of currently married, the demographic groups most similar to Immigrants from Moldova are Immigrants from North Macedonia (48.5%, a difference of 0.0%), Latvian (48.5%, a difference of 0.0%), Immigrants from Netherlands (48.5%, a difference of 0.030%), Immigrants from Austria (48.5%, a difference of 0.060%), and French (48.4%, a difference of 0.080%).
| Demographics | Rating | Rank | Currently Married |
| Northern Europeans | 99.2 /100 | #47 | Exceptional 48.7% |
| Austrians | 99.2 /100 | #48 | Exceptional 48.7% |
| Bhutanese | 99.1 /100 | #49 | Exceptional 48.6% |
| Iranians | 99.0 /100 | #50 | Exceptional 48.6% |
| Whites/Caucasians | 99.0 /100 | #51 | Exceptional 48.6% |
| Russians | 98.9 /100 | #52 | Exceptional 48.6% |
| Immigrants | Austria | 98.8 /100 | #53 | Exceptional 48.5% |
| Immigrants | Moldova | 98.7 /100 | #54 | Exceptional 48.5% |
| Immigrants | North Macedonia | 98.7 /100 | #55 | Exceptional 48.5% |
| Latvians | 98.7 /100 | #56 | Exceptional 48.5% |
| Immigrants | Netherlands | 98.6 /100 | #57 | Exceptional 48.5% |
| French | 98.6 /100 | #58 | Exceptional 48.4% |
| Immigrants | Ireland | 98.5 /100 | #59 | Exceptional 48.4% |
| Immigrants | Romania | 98.5 /100 | #60 | Exceptional 48.4% |
| Romanians | 98.5 /100 | #61 | Exceptional 48.4% |