Alsatian vs Nigerian Family Households with Children
COMPARE
Alsatian
Nigerian
Family Households with Children
Family Households with Children Comparison
Alsatians
Nigerians
25.3%
FAMILY HOUSEHOLDS WITH CHILDREN
0.0/ 100
METRIC RATING
342nd/ 347
METRIC RANK
28.4%
FAMILY HOUSEHOLDS WITH CHILDREN
99.8/ 100
METRIC RATING
77th/ 347
METRIC RANK
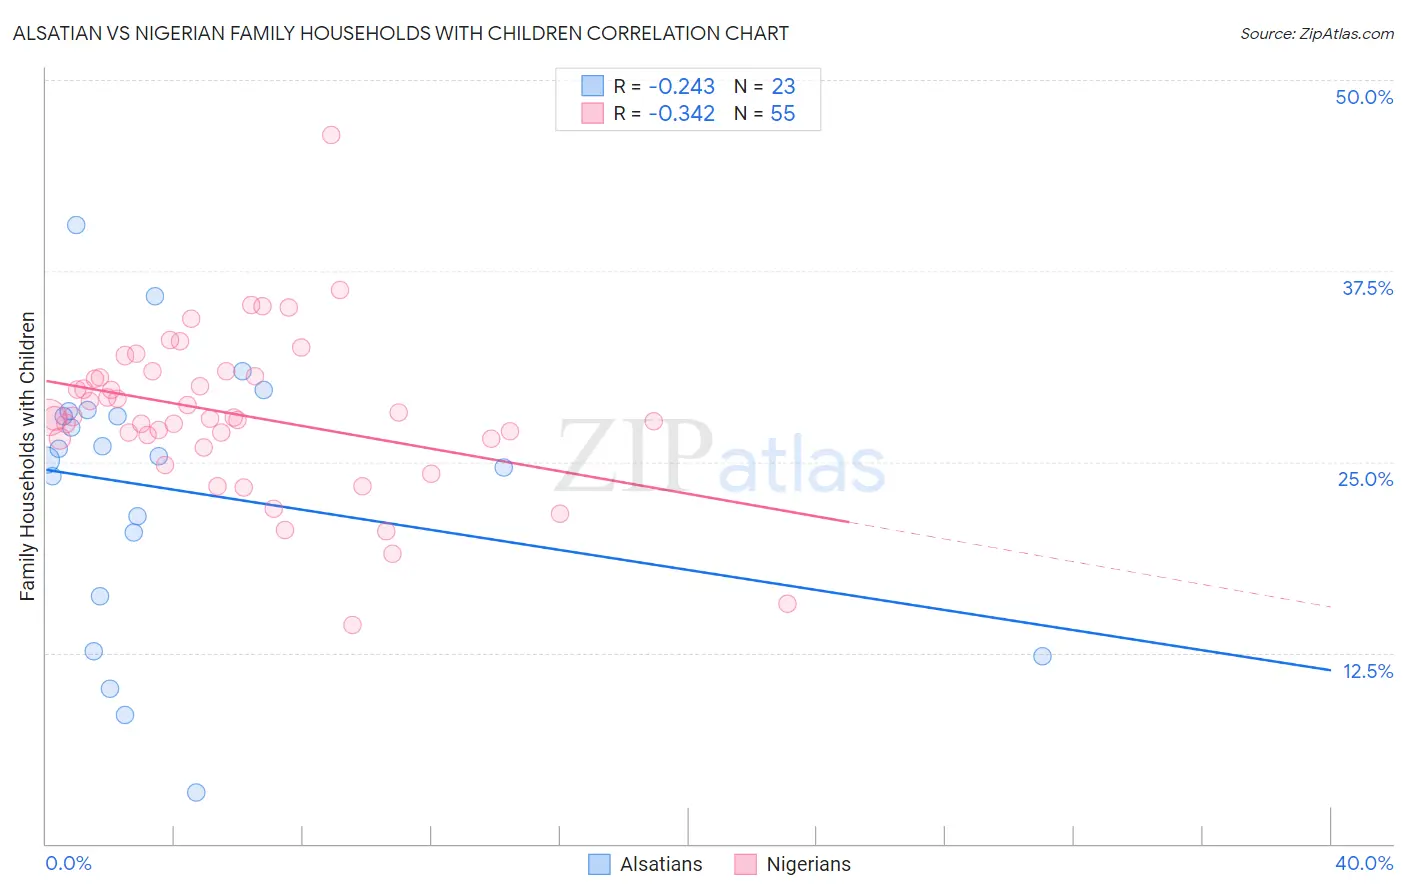
Alsatian vs Nigerian Family Households with Children Correlation Chart
The statistical analysis conducted on geographies consisting of 82,641,288 people shows a weak negative correlation between the proportion of Alsatians and percentage of family households with children in the United States with a correlation coefficient (R) of -0.243 and weighted average of 25.3%. Similarly, the statistical analysis conducted on geographies consisting of 332,387,901 people shows a mild negative correlation between the proportion of Nigerians and percentage of family households with children in the United States with a correlation coefficient (R) of -0.342 and weighted average of 28.4%, a difference of 12.4%.
Family Households with Children Correlation Summary
| Measurement | Alsatian | Nigerian |
| Minimum | 3.4% | 14.3% |
| Maximum | 40.5% | 46.4% |
| Range | 37.1% | 32.1% |
| Mean | 23.2% | 28.1% |
| Median | 25.4% | 27.9% |
| Interquartile 25% (IQ1) | 16.2% | 26.5% |
| Interquartile 75% (IQ3) | 28.3% | 30.6% |
| Interquartile Range (IQR) | 12.1% | 4.1% |
| Standard Deviation (Sample) | 9.0% | 5.2% |
| Standard Deviation (Population) | 8.8% | 5.2% |
Similar Demographics by Family Households with Children
Demographics Similar to Alsatians by Family Households with Children
In terms of family households with children, the demographic groups most similar to Alsatians are Hopi (25.2%, a difference of 0.16%), Pueblo (25.2%, a difference of 0.26%), Immigrants from Grenada (25.2%, a difference of 0.44%), Carpatho Rusyn (25.2%, a difference of 0.44%), and Immigrants from Serbia (25.5%, a difference of 0.68%).
| Demographics | Rating | Rank | Family Households with Children |
| Immigrants | Switzerland | 0.0 /100 | #333 | Tragic 25.7% |
| Slovaks | 0.0 /100 | #334 | Tragic 25.7% |
| Immigrants | Croatia | 0.0 /100 | #335 | Tragic 25.7% |
| Immigrants | West Indies | 0.0 /100 | #336 | Tragic 25.7% |
| Puerto Ricans | 0.0 /100 | #337 | Tragic 25.6% |
| Arapaho | 0.0 /100 | #338 | Tragic 25.6% |
| Immigrants | St. Vincent and the Grenadines | 0.0 /100 | #339 | Tragic 25.6% |
| Immigrants | Armenia | 0.0 /100 | #340 | Tragic 25.6% |
| Immigrants | Serbia | 0.0 /100 | #341 | Tragic 25.5% |
| Alsatians | 0.0 /100 | #342 | Tragic 25.3% |
| Hopi | 0.0 /100 | #343 | Tragic 25.2% |
| Pueblo | 0.0 /100 | #344 | Tragic 25.2% |
| Immigrants | Grenada | 0.0 /100 | #345 | Tragic 25.2% |
| Carpatho Rusyns | 0.0 /100 | #346 | Tragic 25.2% |
| Soviet Union | 0.0 /100 | #347 | Tragic 24.8% |
Demographics Similar to Nigerians by Family Households with Children
In terms of family households with children, the demographic groups most similar to Nigerians are Immigrants from Nepal (28.4%, a difference of 0.040%), Immigrants from Sri Lanka (28.4%, a difference of 0.050%), Immigrants from Jordan (28.4%, a difference of 0.060%), Immigrants from Iraq (28.4%, a difference of 0.070%), and Native/Alaskan (28.4%, a difference of 0.080%).
| Demographics | Rating | Rank | Family Households with Children |
| Immigrants | Honduras | 99.9 /100 | #70 | Exceptional 28.5% |
| Burmese | 99.9 /100 | #71 | Exceptional 28.5% |
| Immigrants | Indonesia | 99.9 /100 | #72 | Exceptional 28.5% |
| Iraqis | 99.9 /100 | #73 | Exceptional 28.5% |
| Laotians | 99.9 /100 | #74 | Exceptional 28.5% |
| Immigrants | Jordan | 99.9 /100 | #75 | Exceptional 28.4% |
| Immigrants | Sri Lanka | 99.9 /100 | #76 | Exceptional 28.4% |
| Nigerians | 99.8 /100 | #77 | Exceptional 28.4% |
| Immigrants | Nepal | 99.8 /100 | #78 | Exceptional 28.4% |
| Immigrants | Iraq | 99.8 /100 | #79 | Exceptional 28.4% |
| Natives/Alaskans | 99.8 /100 | #80 | Exceptional 28.4% |
| South Americans | 99.8 /100 | #81 | Exceptional 28.4% |
| Kenyans | 99.8 /100 | #82 | Exceptional 28.4% |
| Nicaraguans | 99.8 /100 | #83 | Exceptional 28.4% |
| Costa Ricans | 99.8 /100 | #84 | Exceptional 28.4% |