Egyptian vs Immigrants from South Africa Unemployment Among Ages 20 to 24 years
COMPARE
Egyptian
Immigrants from South Africa
Unemployment Among Ages 20 to 24 years
Unemployment Among Ages 20 to 24 years Comparison
Egyptians
Immigrants from South Africa
10.4%
UNEMPLOYMENT AMONG AGES 20 TO 24 YEARS
24.5/ 100
METRIC RATING
195th/ 347
METRIC RANK
10.2%
UNEMPLOYMENT AMONG AGES 20 TO 24 YEARS
73.6/ 100
METRIC RATING
151st/ 347
METRIC RANK
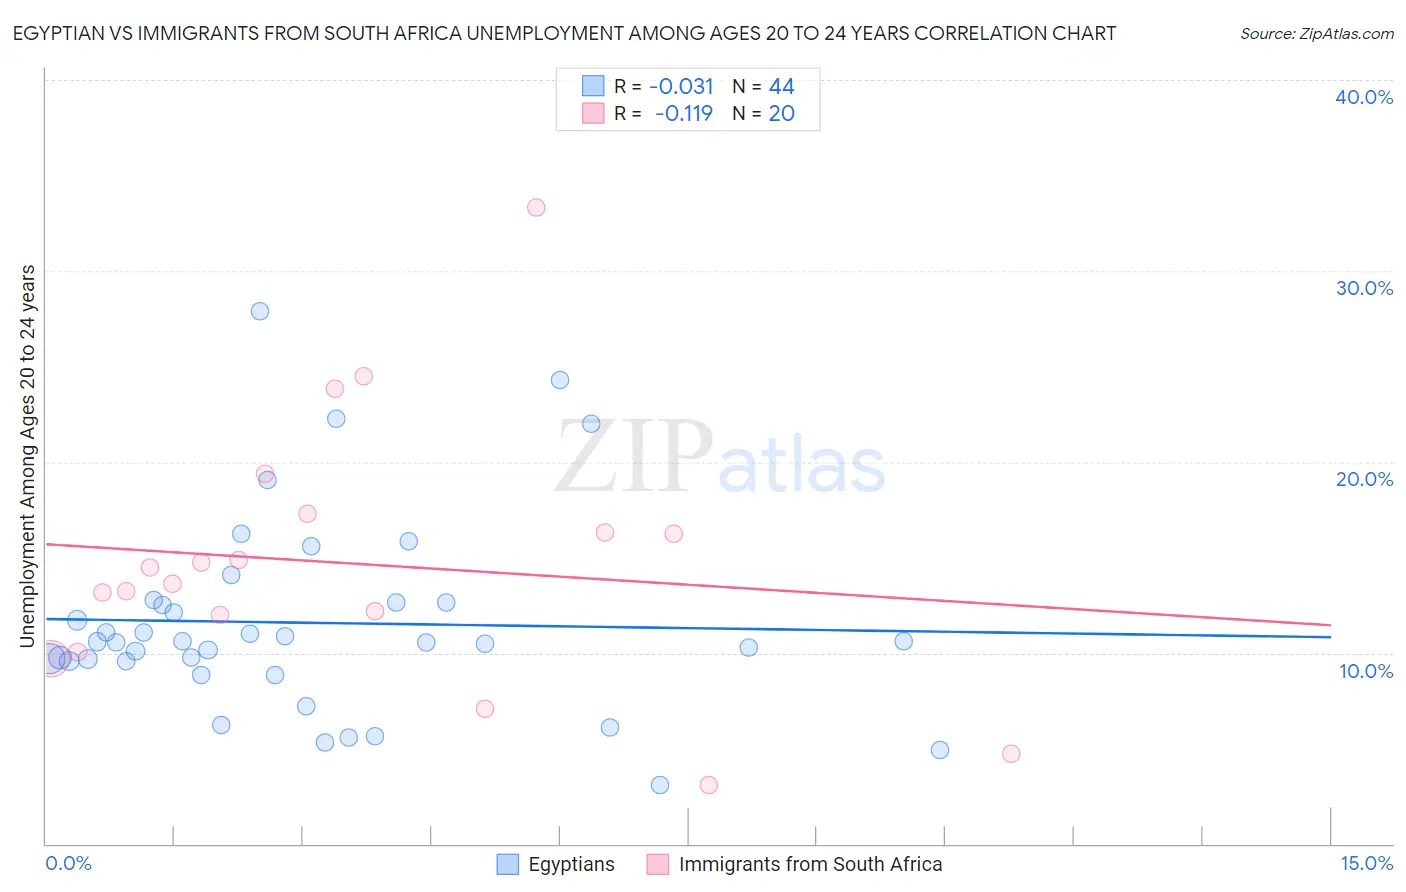
Egyptian vs Immigrants from South Africa Unemployment Among Ages 20 to 24 years Correlation Chart
The statistical analysis conducted on geographies consisting of 272,756,089 people shows no correlation between the proportion of Egyptians and unemployment rate among population between the ages 20 and 24 in the United States with a correlation coefficient (R) of -0.031 and weighted average of 10.4%. Similarly, the statistical analysis conducted on geographies consisting of 228,793,193 people shows a poor negative correlation between the proportion of Immigrants from South Africa and unemployment rate among population between the ages 20 and 24 in the United States with a correlation coefficient (R) of -0.119 and weighted average of 10.2%, a difference of 2.0%.
Unemployment Among Ages 20 to 24 years Correlation Summary
| Measurement | Egyptian | Immigrants from South Africa |
| Minimum | 3.1% | 3.1% |
| Maximum | 27.9% | 33.3% |
| Range | 24.8% | 30.2% |
| Mean | 11.6% | 14.7% |
| Median | 10.6% | 14.0% |
| Interquartile 25% (IQ1) | 9.6% | 11.0% |
| Interquartile 75% (IQ3) | 12.6% | 16.8% |
| Interquartile Range (IQR) | 3.1% | 5.8% |
| Standard Deviation (Sample) | 5.1% | 7.0% |
| Standard Deviation (Population) | 5.1% | 6.8% |
Similar Demographics by Unemployment Among Ages 20 to 24 years
Demographics Similar to Egyptians by Unemployment Among Ages 20 to 24 years
In terms of unemployment among ages 20 to 24 years, the demographic groups most similar to Egyptians are Immigrants from Philippines (10.4%, a difference of 0.020%), Immigrants from Italy (10.4%, a difference of 0.030%), Immigrants from Portugal (10.4%, a difference of 0.040%), Ugandan (10.4%, a difference of 0.060%), and Immigrants from Eastern Europe (10.4%, a difference of 0.070%).
| Demographics | Rating | Rank | Unemployment Among Ages 20 to 24 years |
| Immigrants | Russia | 34.6 /100 | #188 | Fair 10.4% |
| Hawaiians | 33.9 /100 | #189 | Fair 10.4% |
| Immigrants | China | 32.6 /100 | #190 | Fair 10.4% |
| Immigrants | Eastern Europe | 25.8 /100 | #191 | Fair 10.4% |
| Ugandans | 25.7 /100 | #192 | Fair 10.4% |
| Immigrants | Portugal | 25.3 /100 | #193 | Fair 10.4% |
| Immigrants | Italy | 25.0 /100 | #194 | Fair 10.4% |
| Egyptians | 24.5 /100 | #195 | Fair 10.4% |
| Immigrants | Philippines | 24.1 /100 | #196 | Fair 10.4% |
| Immigrants | Denmark | 22.8 /100 | #197 | Fair 10.4% |
| Colombians | 22.3 /100 | #198 | Fair 10.4% |
| Portuguese | 21.8 /100 | #199 | Fair 10.4% |
| Russians | 21.2 /100 | #200 | Fair 10.4% |
| Immigrants | Peru | 21.2 /100 | #201 | Fair 10.4% |
| Immigrants | Middle Africa | 20.9 /100 | #202 | Fair 10.4% |
Demographics Similar to Immigrants from South Africa by Unemployment Among Ages 20 to 24 years
In terms of unemployment among ages 20 to 24 years, the demographic groups most similar to Immigrants from South Africa are Hungarian (10.2%, a difference of 0.040%), Immigrants from Scotland (10.2%, a difference of 0.050%), Iranian (10.2%, a difference of 0.060%), Immigrants from Romania (10.2%, a difference of 0.10%), and Immigrants from Taiwan (10.2%, a difference of 0.10%).
| Demographics | Rating | Rank | Unemployment Among Ages 20 to 24 years |
| Brazilians | 78.4 /100 | #144 | Good 10.2% |
| Argentineans | 78.0 /100 | #145 | Good 10.2% |
| Asians | 77.7 /100 | #146 | Good 10.2% |
| French Canadians | 77.5 /100 | #147 | Good 10.2% |
| Immigrants | Romania | 75.7 /100 | #148 | Good 10.2% |
| Immigrants | Scotland | 74.6 /100 | #149 | Good 10.2% |
| Hungarians | 74.4 /100 | #150 | Good 10.2% |
| Immigrants | South Africa | 73.6 /100 | #151 | Good 10.2% |
| Iranians | 72.4 /100 | #152 | Good 10.2% |
| Immigrants | Taiwan | 71.4 /100 | #153 | Good 10.2% |
| Immigrants | Switzerland | 71.3 /100 | #154 | Good 10.2% |
| Lithuanians | 70.0 /100 | #155 | Good 10.2% |
| Canadians | 66.7 /100 | #156 | Good 10.2% |
| Immigrants | Uganda | 65.6 /100 | #157 | Good 10.2% |
| Immigrants | Kazakhstan | 65.5 /100 | #158 | Good 10.2% |