Czech vs Immigrants from Jamaica Single Mother Households
COMPARE
Czech
Immigrants from Jamaica
Single Mother Households
Single Mother Households Comparison
Czechs
Immigrants from Jamaica
5.6%
SINGLE MOTHER HOUSEHOLDS
97.9/ 100
METRIC RATING
80th/ 347
METRIC RANK
8.4%
SINGLE MOTHER HOUSEHOLDS
0.0/ 100
METRIC RATING
324th/ 347
METRIC RANK
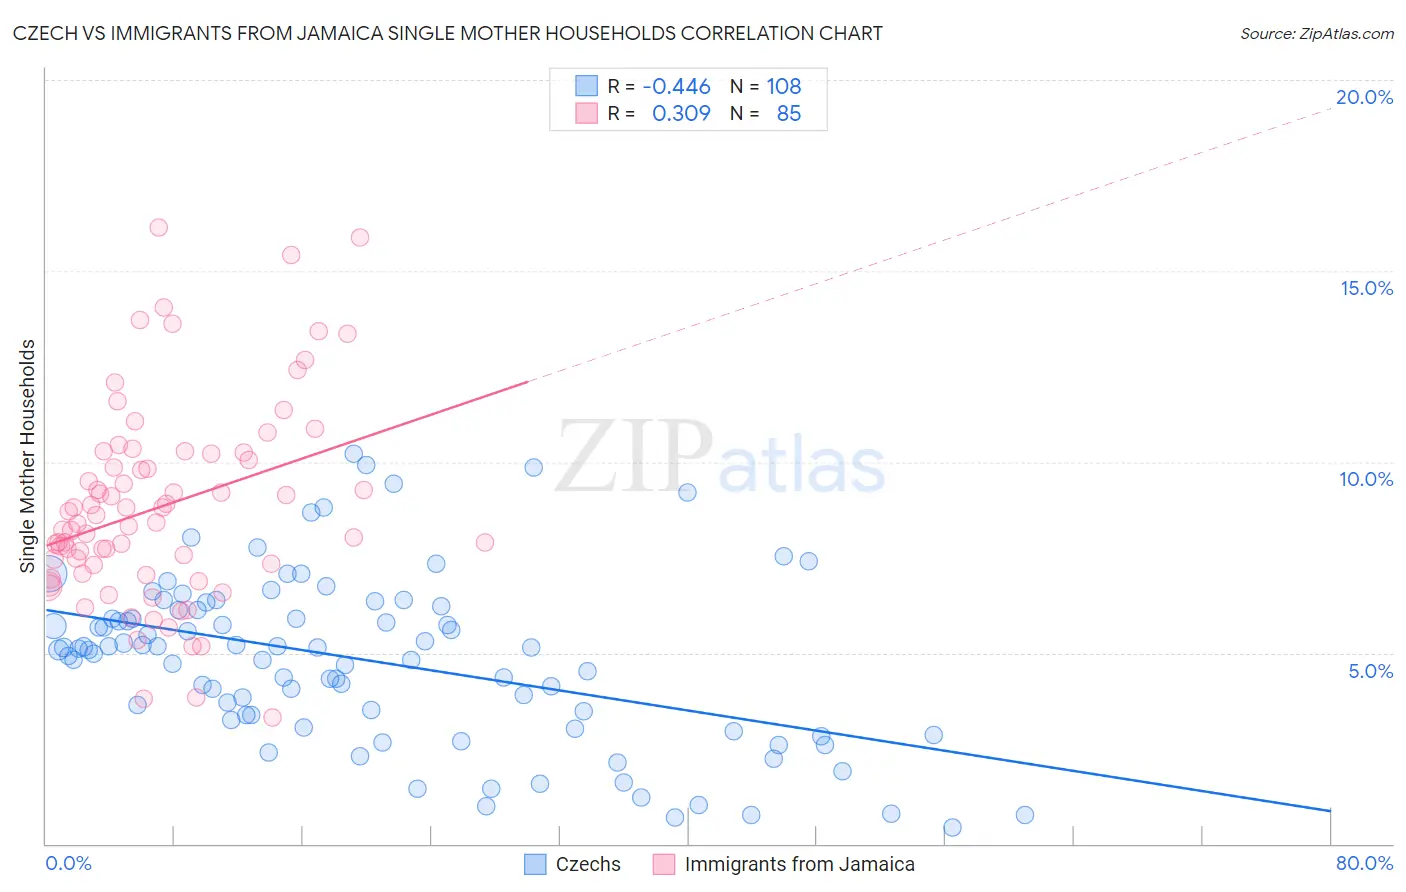
Czech vs Immigrants from Jamaica Single Mother Households Correlation Chart
The statistical analysis conducted on geographies consisting of 482,317,473 people shows a moderate negative correlation between the proportion of Czechs and percentage of single mother households in the United States with a correlation coefficient (R) of -0.446 and weighted average of 5.6%. Similarly, the statistical analysis conducted on geographies consisting of 301,259,043 people shows a mild positive correlation between the proportion of Immigrants from Jamaica and percentage of single mother households in the United States with a correlation coefficient (R) of 0.309 and weighted average of 8.4%, a difference of 48.0%.
Single Mother Households Correlation Summary
| Measurement | Czech | Immigrants from Jamaica |
| Minimum | 0.43% | 3.3% |
| Maximum | 10.2% | 16.1% |
| Range | 9.8% | 12.8% |
| Mean | 4.8% | 8.8% |
| Median | 5.1% | 8.4% |
| Interquartile 25% (IQ1) | 3.3% | 7.2% |
| Interquartile 75% (IQ3) | 6.1% | 10.2% |
| Interquartile Range (IQR) | 2.8% | 3.0% |
| Standard Deviation (Sample) | 2.2% | 2.6% |
| Standard Deviation (Population) | 2.2% | 2.6% |
Similar Demographics by Single Mother Households
Demographics Similar to Czechs by Single Mother Households
In terms of single mother households, the demographic groups most similar to Czechs are Immigrants from Moldova (5.6%, a difference of 0.0%), Immigrants from Sri Lanka (5.6%, a difference of 0.11%), Immigrants from Malaysia (5.7%, a difference of 0.22%), Immigrants from Hungary (5.7%, a difference of 0.24%), and Romanian (5.6%, a difference of 0.31%).
| Demographics | Rating | Rank | Single Mother Households |
| Immigrants | Asia | 98.4 /100 | #73 | Exceptional 5.6% |
| Immigrants | North America | 98.3 /100 | #74 | Exceptional 5.6% |
| Slovenes | 98.3 /100 | #75 | Exceptional 5.6% |
| New Zealanders | 98.2 /100 | #76 | Exceptional 5.6% |
| Romanians | 98.1 /100 | #77 | Exceptional 5.6% |
| Swiss | 98.1 /100 | #78 | Exceptional 5.6% |
| Immigrants | Sri Lanka | 98.0 /100 | #79 | Exceptional 5.6% |
| Czechs | 97.9 /100 | #80 | Exceptional 5.6% |
| Immigrants | Moldova | 97.9 /100 | #81 | Exceptional 5.6% |
| Immigrants | Malaysia | 97.8 /100 | #82 | Exceptional 5.7% |
| Immigrants | Hungary | 97.8 /100 | #83 | Exceptional 5.7% |
| Carpatho Rusyns | 97.7 /100 | #84 | Exceptional 5.7% |
| Hungarians | 97.6 /100 | #85 | Exceptional 5.7% |
| Finns | 97.6 /100 | #86 | Exceptional 5.7% |
| Immigrants | Turkey | 97.5 /100 | #87 | Exceptional 5.7% |
Demographics Similar to Immigrants from Jamaica by Single Mother Households
In terms of single mother households, the demographic groups most similar to Immigrants from Jamaica are Immigrants from Caribbean (8.4%, a difference of 0.18%), British West Indian (8.4%, a difference of 0.31%), Haitian (8.3%, a difference of 0.43%), Immigrants from Haiti (8.4%, a difference of 0.46%), and Yakama (8.4%, a difference of 0.63%).
| Demographics | Rating | Rank | Single Mother Households |
| Immigrants | Honduras | 0.0 /100 | #317 | Tragic 8.2% |
| Senegalese | 0.0 /100 | #318 | Tragic 8.2% |
| Jamaicans | 0.0 /100 | #319 | Tragic 8.2% |
| Bahamians | 0.0 /100 | #320 | Tragic 8.3% |
| Immigrants | Senegal | 0.0 /100 | #321 | Tragic 8.3% |
| Pima | 0.0 /100 | #322 | Tragic 8.3% |
| Haitians | 0.0 /100 | #323 | Tragic 8.3% |
| Immigrants | Jamaica | 0.0 /100 | #324 | Tragic 8.4% |
| Immigrants | Caribbean | 0.0 /100 | #325 | Tragic 8.4% |
| British West Indians | 0.0 /100 | #326 | Tragic 8.4% |
| Immigrants | Haiti | 0.0 /100 | #327 | Tragic 8.4% |
| Yakama | 0.0 /100 | #328 | Tragic 8.4% |
| Hopi | 0.0 /100 | #329 | Tragic 8.5% |
| Inupiat | 0.0 /100 | #330 | Tragic 8.5% |
| Sioux | 0.0 /100 | #331 | Tragic 8.5% |