Immigrants from Eastern Asia vs Immigrants from Dominican Republic Single Mother Households
COMPARE
Immigrants from Eastern Asia
Immigrants from Dominican Republic
Single Mother Households
Single Mother Households Comparison
Immigrants from Eastern Asia
Immigrants from Dominican Republic
5.1%
SINGLE MOTHER HOUSEHOLDS
99.9/ 100
METRIC RATING
15th/ 347
METRIC RANK
9.5%
SINGLE MOTHER HOUSEHOLDS
0.0/ 100
METRIC RATING
344th/ 347
METRIC RANK
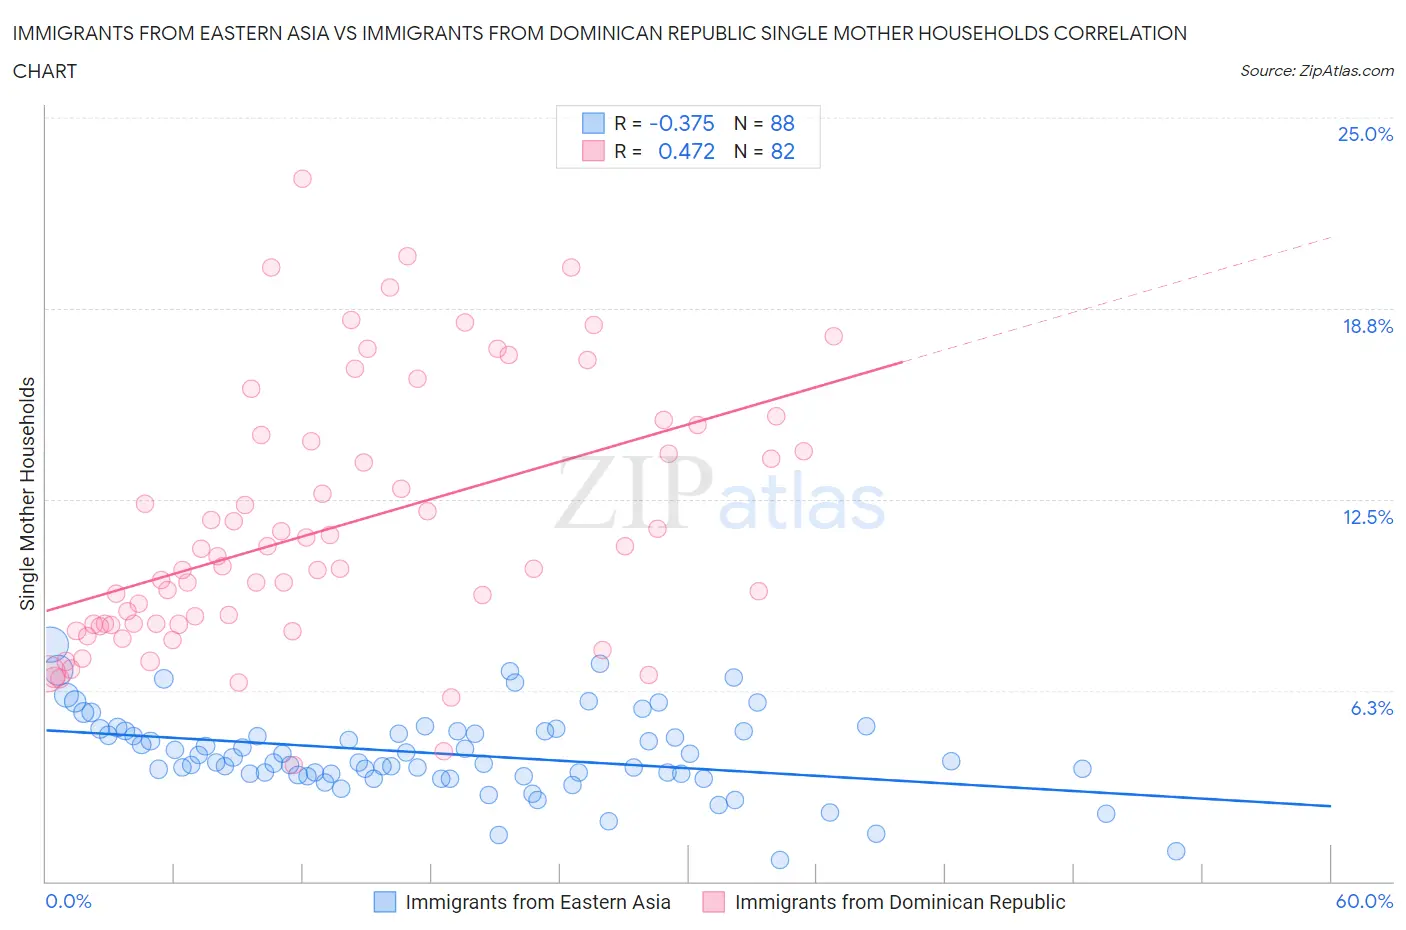
Immigrants from Eastern Asia vs Immigrants from Dominican Republic Single Mother Households Correlation Chart
The statistical analysis conducted on geographies consisting of 497,405,712 people shows a mild negative correlation between the proportion of Immigrants from Eastern Asia and percentage of single mother households in the United States with a correlation coefficient (R) of -0.375 and weighted average of 5.1%. Similarly, the statistical analysis conducted on geographies consisting of 274,598,570 people shows a moderate positive correlation between the proportion of Immigrants from Dominican Republic and percentage of single mother households in the United States with a correlation coefficient (R) of 0.472 and weighted average of 9.5%, a difference of 86.5%.
Single Mother Households Correlation Summary
| Measurement | Immigrants from Eastern Asia | Immigrants from Dominican Republic |
| Minimum | 0.70% | 3.8% |
| Maximum | 7.7% | 23.0% |
| Range | 7.0% | 19.2% |
| Mean | 4.2% | 11.5% |
| Median | 3.9% | 10.3% |
| Interquartile 25% (IQ1) | 3.5% | 8.4% |
| Interquartile 75% (IQ3) | 4.9% | 14.4% |
| Interquartile Range (IQR) | 1.4% | 6.0% |
| Standard Deviation (Sample) | 1.3% | 4.2% |
| Standard Deviation (Population) | 1.3% | 4.2% |
Similar Demographics by Single Mother Households
Demographics Similar to Immigrants from Eastern Asia by Single Mother Households
In terms of single mother households, the demographic groups most similar to Immigrants from Eastern Asia are Immigrants from Australia (5.1%, a difference of 0.090%), Indian (Asian) (5.1%, a difference of 0.19%), Soviet Union (5.1%, a difference of 0.40%), Immigrants from India (5.1%, a difference of 0.42%), and Cypriot (5.1%, a difference of 0.54%).
| Demographics | Rating | Rank | Single Mother Households |
| Immigrants | Ireland | 99.9 /100 | #8 | Exceptional 5.0% |
| Okinawans | 99.9 /100 | #9 | Exceptional 5.0% |
| Immigrants | Israel | 99.9 /100 | #10 | Exceptional 5.0% |
| Immigrants | China | 99.9 /100 | #11 | Exceptional 5.1% |
| Cypriots | 99.9 /100 | #12 | Exceptional 5.1% |
| Immigrants | India | 99.9 /100 | #13 | Exceptional 5.1% |
| Immigrants | Australia | 99.9 /100 | #14 | Exceptional 5.1% |
| Immigrants | Eastern Asia | 99.9 /100 | #15 | Exceptional 5.1% |
| Indians (Asian) | 99.9 /100 | #16 | Exceptional 5.1% |
| Soviet Union | 99.9 /100 | #17 | Exceptional 5.1% |
| Immigrants | Armenia | 99.9 /100 | #18 | Exceptional 5.2% |
| Chinese | 99.9 /100 | #19 | Exceptional 5.2% |
| Maltese | 99.9 /100 | #20 | Exceptional 5.2% |
| Eastern Europeans | 99.8 /100 | #21 | Exceptional 5.2% |
| Thais | 99.8 /100 | #22 | Exceptional 5.2% |
Demographics Similar to Immigrants from Dominican Republic by Single Mother Households
In terms of single mother households, the demographic groups most similar to Immigrants from Dominican Republic are Immigrants from Cabo Verde (9.6%, a difference of 0.78%), Yuman (9.6%, a difference of 1.4%), Dominican (9.2%, a difference of 3.5%), Menominee (9.2%, a difference of 3.7%), and Tohono O'odham (9.1%, a difference of 4.1%).
| Demographics | Rating | Rank | Single Mother Households |
| Liberians | 0.0 /100 | #333 | Tragic 8.6% |
| Immigrants | Liberia | 0.0 /100 | #334 | Tragic 8.7% |
| Immigrants | Dominica | 0.0 /100 | #335 | Tragic 8.7% |
| Puerto Ricans | 0.0 /100 | #336 | Tragic 8.7% |
| Navajo | 0.0 /100 | #337 | Tragic 8.8% |
| Cape Verdeans | 0.0 /100 | #338 | Tragic 8.9% |
| Blacks/African Americans | 0.0 /100 | #339 | Tragic 9.0% |
| Lumbee | 0.0 /100 | #340 | Tragic 9.1% |
| Tohono O'odham | 0.0 /100 | #341 | Tragic 9.1% |
| Menominee | 0.0 /100 | #342 | Tragic 9.2% |
| Dominicans | 0.0 /100 | #343 | Tragic 9.2% |
| Immigrants | Dominican Republic | 0.0 /100 | #344 | Tragic 9.5% |
| Immigrants | Cabo Verde | 0.0 /100 | #345 | Tragic 9.6% |
| Yuman | 0.0 /100 | #346 | Tragic 9.6% |
| Yup'ik | 0.0 /100 | #347 | Tragic 10.0% |