Egyptian vs Immigrants from Congo 1st Grade
COMPARE
Egyptian
Immigrants from Congo
1st Grade
1st Grade Comparison
Egyptians
Immigrants from Congo
97.9%
1ST GRADE
42.7/ 100
METRIC RATING
182nd/ 347
METRIC RANK
97.5%
1ST GRADE
0.7/ 100
METRIC RATING
253rd/ 347
METRIC RANK
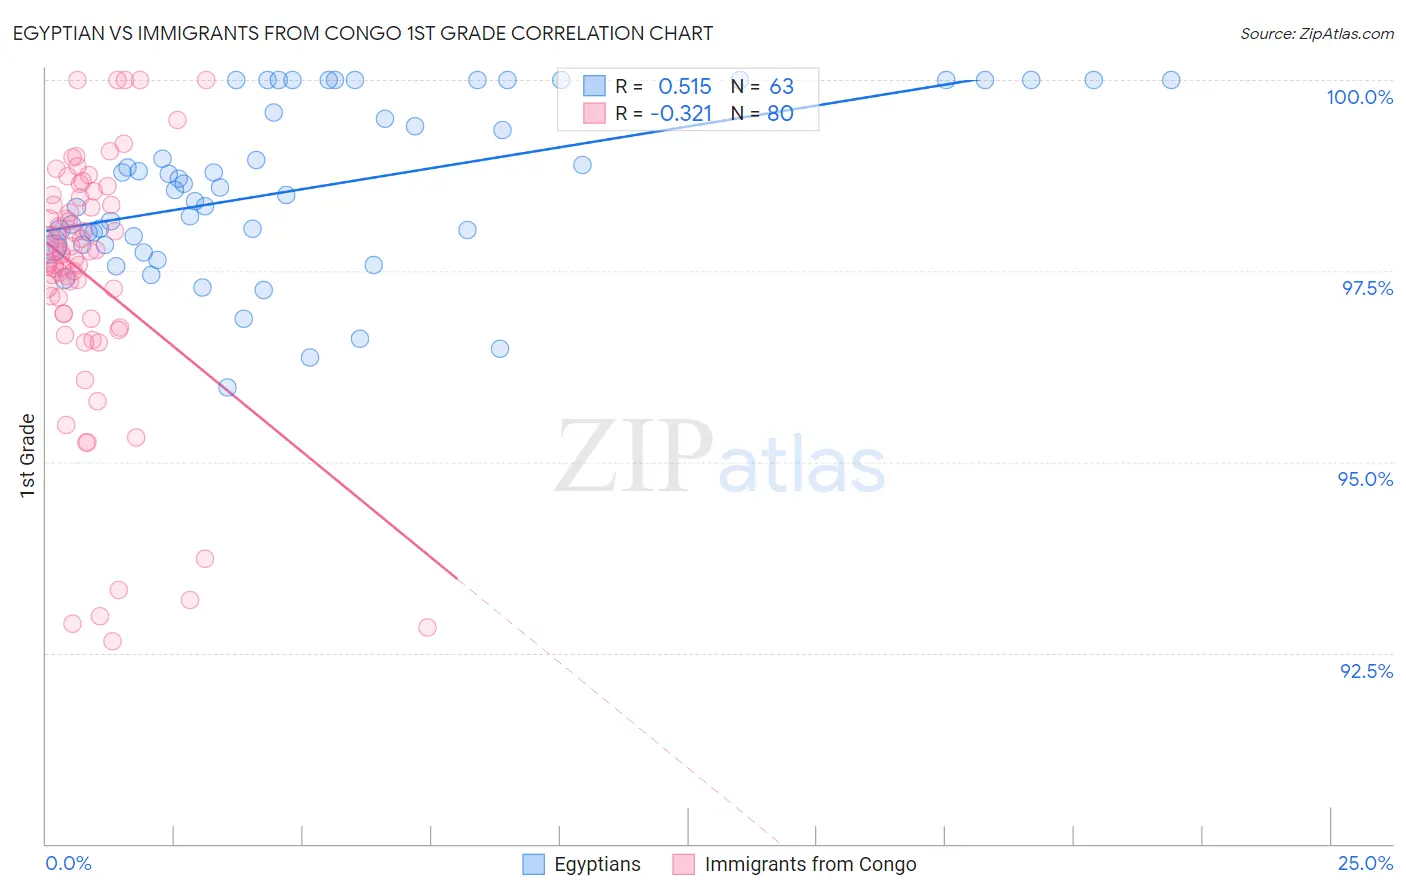
Egyptian vs Immigrants from Congo 1st Grade Correlation Chart
The statistical analysis conducted on geographies consisting of 276,927,519 people shows a substantial positive correlation between the proportion of Egyptians and percentage of population with at least 1st grade education in the United States with a correlation coefficient (R) of 0.515 and weighted average of 97.9%. Similarly, the statistical analysis conducted on geographies consisting of 92,124,753 people shows a mild negative correlation between the proportion of Immigrants from Congo and percentage of population with at least 1st grade education in the United States with a correlation coefficient (R) of -0.321 and weighted average of 97.5%, a difference of 0.36%.
1st Grade Correlation Summary
| Measurement | Egyptian | Immigrants from Congo |
| Minimum | 96.0% | 92.6% |
| Maximum | 100.0% | 100.0% |
| Range | 4.0% | 7.4% |
| Mean | 98.6% | 97.4% |
| Median | 98.6% | 97.7% |
| Interquartile 25% (IQ1) | 97.8% | 96.9% |
| Interquartile 75% (IQ3) | 100.0% | 98.4% |
| Interquartile Range (IQR) | 2.2% | 1.5% |
| Standard Deviation (Sample) | 1.1% | 1.7% |
| Standard Deviation (Population) | 1.1% | 1.7% |
Similar Demographics by 1st Grade
Demographics Similar to Egyptians by 1st Grade
In terms of 1st grade, the demographic groups most similar to Egyptians are Portuguese (97.9%, a difference of 0.0%), Immigrants from Argentina (97.9%, a difference of 0.0%), Argentinean (97.9%, a difference of 0.010%), Immigrants from Bosnia and Herzegovina (97.9%, a difference of 0.010%), and Immigrants from Poland (97.9%, a difference of 0.010%).
| Demographics | Rating | Rank | 1st Grade |
| Immigrants | Sri Lanka | 49.7 /100 | #175 | Average 97.9% |
| Albanians | 49.6 /100 | #176 | Average 97.9% |
| Immigrants | Brazil | 49.1 /100 | #177 | Average 97.9% |
| Immigrants | Venezuela | 47.8 /100 | #178 | Average 97.9% |
| Argentineans | 47.2 /100 | #179 | Average 97.9% |
| Immigrants | Bosnia and Herzegovina | 46.6 /100 | #180 | Average 97.9% |
| Portuguese | 44.2 /100 | #181 | Average 97.9% |
| Egyptians | 42.7 /100 | #182 | Average 97.9% |
| Immigrants | Argentina | 41.3 /100 | #183 | Average 97.9% |
| Immigrants | Poland | 40.1 /100 | #184 | Average 97.9% |
| Immigrants | Belarus | 39.3 /100 | #185 | Fair 97.9% |
| Paiute | 36.5 /100 | #186 | Fair 97.9% |
| Pakistanis | 35.8 /100 | #187 | Fair 97.9% |
| Arabs | 35.5 /100 | #188 | Fair 97.9% |
| Immigrants | Kazakhstan | 34.9 /100 | #189 | Fair 97.9% |
Demographics Similar to Immigrants from Congo by 1st Grade
In terms of 1st grade, the demographic groups most similar to Immigrants from Congo are Immigrants from Asia (97.5%, a difference of 0.0%), Immigrants from Africa (97.6%, a difference of 0.010%), Immigrants from Colombia (97.5%, a difference of 0.010%), Jamaican (97.5%, a difference of 0.010%), and Ethiopian (97.6%, a difference of 0.020%).
| Demographics | Rating | Rank | 1st Grade |
| Immigrants | Eastern Africa | 1.0 /100 | #246 | Tragic 97.6% |
| Peruvians | 1.0 /100 | #247 | Tragic 97.6% |
| Immigrants | Middle Africa | 1.0 /100 | #248 | Tragic 97.6% |
| Immigrants | Senegal | 1.0 /100 | #249 | Tragic 97.6% |
| Ethiopians | 0.9 /100 | #250 | Tragic 97.6% |
| Immigrants | Iraq | 0.9 /100 | #251 | Tragic 97.6% |
| Immigrants | Africa | 0.9 /100 | #252 | Tragic 97.6% |
| Immigrants | Congo | 0.7 /100 | #253 | Tragic 97.5% |
| Immigrants | Asia | 0.7 /100 | #254 | Tragic 97.5% |
| Immigrants | Colombia | 0.6 /100 | #255 | Tragic 97.5% |
| Jamaicans | 0.6 /100 | #256 | Tragic 97.5% |
| Yaqui | 0.6 /100 | #257 | Tragic 97.5% |
| Indians (Asian) | 0.6 /100 | #258 | Tragic 97.5% |
| Fijians | 0.5 /100 | #259 | Tragic 97.5% |
| Armenians | 0.5 /100 | #260 | Tragic 97.5% |