Ecuadorian vs Hispanic or Latino Single Father Households
COMPARE
Ecuadorian
Hispanic or Latino
Single Father Households
Single Father Households Comparison
Ecuadorians
Hispanics or Latinos
2.4%
SINGLE FATHER HOUSEHOLDS
24.5/ 100
METRIC RATING
204th/ 347
METRIC RANK
2.8%
SINGLE FATHER HOUSEHOLDS
0.0/ 100
METRIC RATING
305th/ 347
METRIC RANK
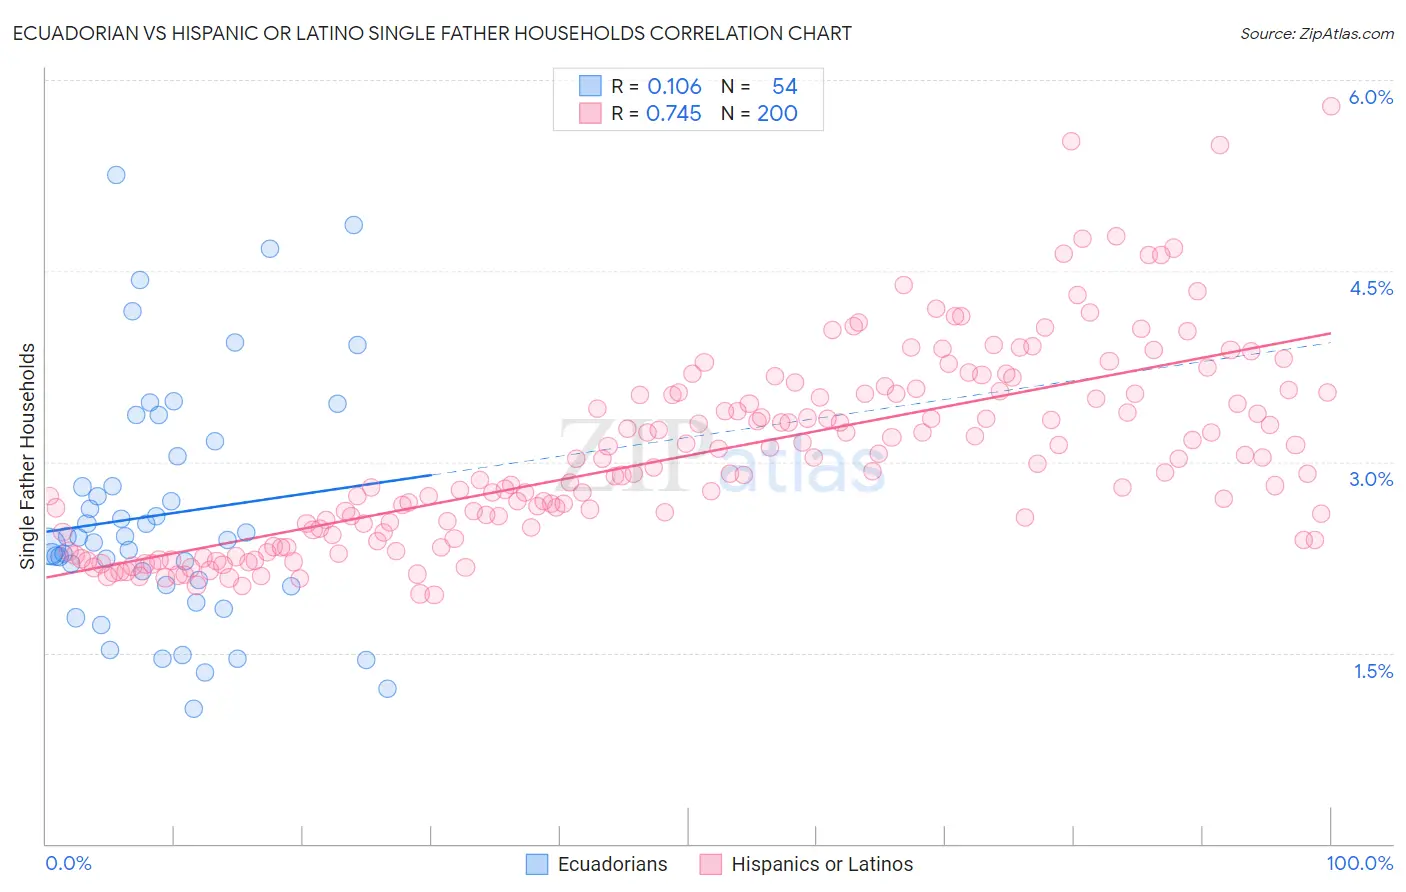
Ecuadorian vs Hispanic or Latino Single Father Households Correlation Chart
The statistical analysis conducted on geographies consisting of 315,595,316 people shows a poor positive correlation between the proportion of Ecuadorians and percentage of single father households in the United States with a correlation coefficient (R) of 0.106 and weighted average of 2.4%. Similarly, the statistical analysis conducted on geographies consisting of 562,137,491 people shows a strong positive correlation between the proportion of Hispanics or Latinos and percentage of single father households in the United States with a correlation coefficient (R) of 0.745 and weighted average of 2.8%, a difference of 18.1%.
Single Father Households Correlation Summary
| Measurement | Ecuadorian | Hispanic or Latino |
| Minimum | 1.1% | 2.0% |
| Maximum | 5.3% | 5.8% |
| Range | 4.2% | 3.8% |
| Mean | 2.6% | 3.1% |
| Median | 2.4% | 2.9% |
| Interquartile 25% (IQ1) | 2.0% | 2.4% |
| Interquartile 75% (IQ3) | 3.0% | 3.5% |
| Interquartile Range (IQR) | 1.0% | 1.1% |
| Standard Deviation (Sample) | 0.94% | 0.75% |
| Standard Deviation (Population) | 0.93% | 0.75% |
Similar Demographics by Single Father Households
Demographics Similar to Ecuadorians by Single Father Households
In terms of single father households, the demographic groups most similar to Ecuadorians are French Canadian (2.4%, a difference of 0.020%), Immigrants from Afghanistan (2.4%, a difference of 0.030%), Korean (2.4%, a difference of 0.030%), German Russian (2.4%, a difference of 0.12%), and Immigrants from Uganda (2.4%, a difference of 0.15%).
| Demographics | Rating | Rank | Single Father Households |
| Germans | 28.0 /100 | #197 | Fair 2.4% |
| Scandinavians | 27.4 /100 | #198 | Fair 2.4% |
| Immigrants | Vietnam | 27.1 /100 | #199 | Fair 2.4% |
| Peruvians | 27.1 /100 | #200 | Fair 2.4% |
| Immigrants | Uganda | 26.0 /100 | #201 | Fair 2.4% |
| German Russians | 25.7 /100 | #202 | Fair 2.4% |
| French Canadians | 24.7 /100 | #203 | Fair 2.4% |
| Ecuadorians | 24.5 /100 | #204 | Fair 2.4% |
| Immigrants | Afghanistan | 24.2 /100 | #205 | Fair 2.4% |
| Koreans | 24.1 /100 | #206 | Fair 2.4% |
| Whites/Caucasians | 22.6 /100 | #207 | Fair 2.4% |
| Immigrants | Kenya | 20.3 /100 | #208 | Fair 2.4% |
| Immigrants | Peru | 19.3 /100 | #209 | Poor 2.4% |
| Immigrants | Costa Rica | 19.2 /100 | #210 | Poor 2.4% |
| Immigrants | Nigeria | 18.7 /100 | #211 | Poor 2.4% |
Demographics Similar to Hispanics or Latinos by Single Father Households
In terms of single father households, the demographic groups most similar to Hispanics or Latinos are Mexican American Indian (2.8%, a difference of 0.15%), Immigrants from the Azores (2.8%, a difference of 0.16%), Hopi (2.8%, a difference of 0.32%), Immigrants from Honduras (2.8%, a difference of 0.47%), and Spanish American (2.8%, a difference of 0.49%).
| Demographics | Rating | Rank | Single Father Households |
| Cree | 0.0 /100 | #298 | Tragic 2.8% |
| Lumbee | 0.0 /100 | #299 | Tragic 2.8% |
| Kiowa | 0.0 /100 | #300 | Tragic 2.8% |
| Immigrants | Latin America | 0.0 /100 | #301 | Tragic 2.8% |
| Spanish Americans | 0.0 /100 | #302 | Tragic 2.8% |
| Immigrants | Honduras | 0.0 /100 | #303 | Tragic 2.8% |
| Mexican American Indians | 0.0 /100 | #304 | Tragic 2.8% |
| Hispanics or Latinos | 0.0 /100 | #305 | Tragic 2.8% |
| Immigrants | Azores | 0.0 /100 | #306 | Tragic 2.8% |
| Hopi | 0.0 /100 | #307 | Tragic 2.8% |
| Apache | 0.0 /100 | #308 | Tragic 2.8% |
| Central Americans | 0.0 /100 | #309 | Tragic 2.9% |
| Immigrants | Laos | 0.0 /100 | #310 | Tragic 2.9% |
| Spanish American Indians | 0.0 /100 | #311 | Tragic 2.9% |
| Tsimshian | 0.0 /100 | #312 | Tragic 2.9% |