Immigrants from Trinidad and Tobago vs Immigrants from Norway Family Households with Children
COMPARE
Immigrants from Trinidad and Tobago
Immigrants from Norway
Family Households with Children
Family Households with Children Comparison
Immigrants from Trinidad and Tobago
Immigrants from Norway
26.4%
FAMILY HOUSEHOLDS WITH CHILDREN
0.1/ 100
METRIC RATING
301st/ 347
METRIC RANK
26.1%
FAMILY HOUSEHOLDS WITH CHILDREN
0.0/ 100
METRIC RATING
315th/ 347
METRIC RANK
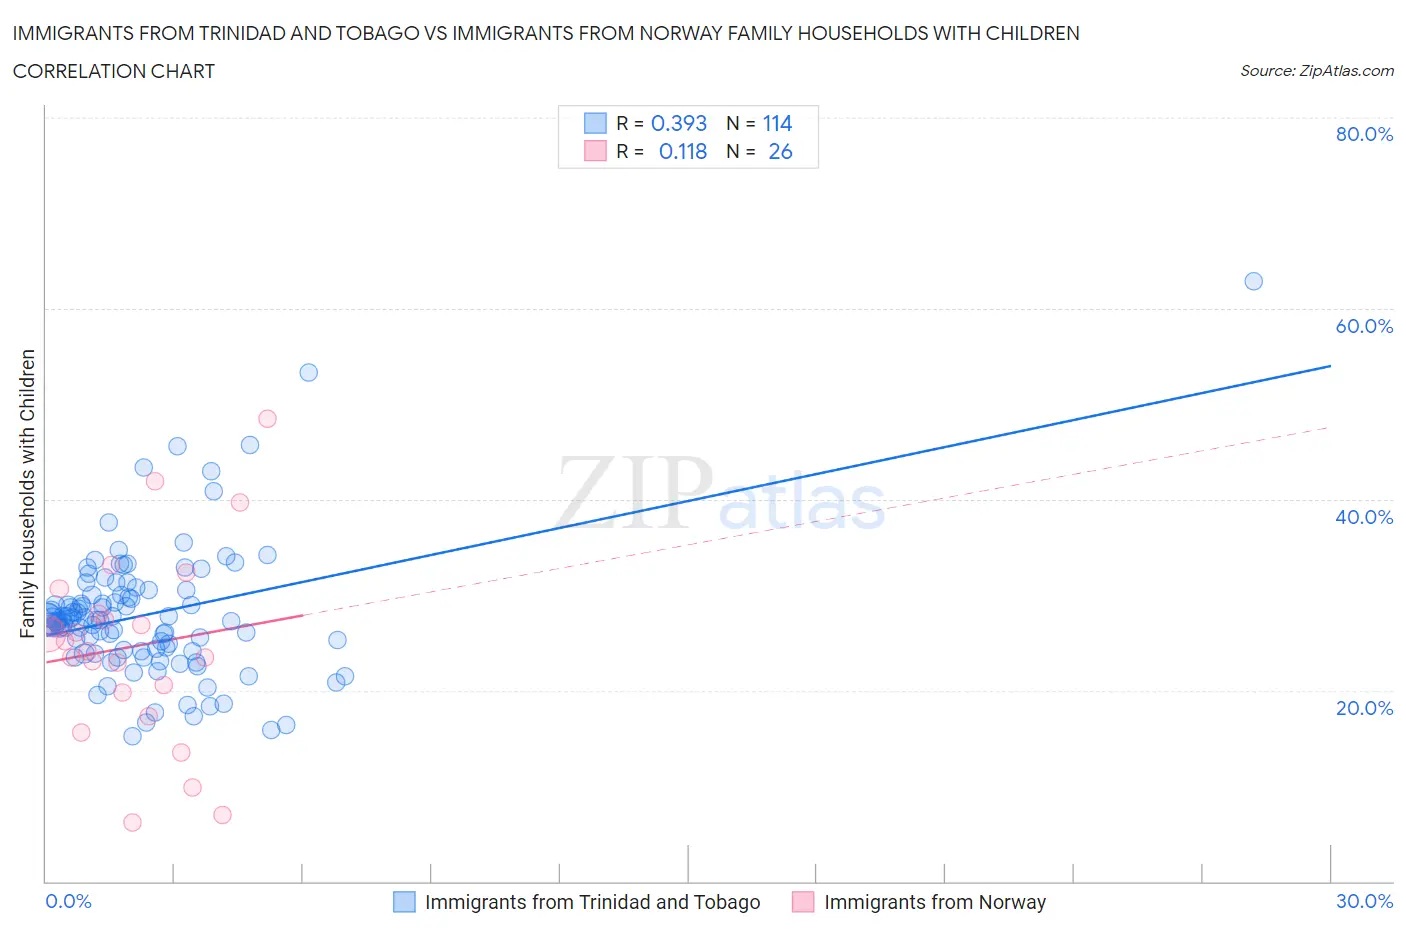
Immigrants from Trinidad and Tobago vs Immigrants from Norway Family Households with Children Correlation Chart
The statistical analysis conducted on geographies consisting of 223,431,960 people shows a mild positive correlation between the proportion of Immigrants from Trinidad and Tobago and percentage of family households with children in the United States with a correlation coefficient (R) of 0.393 and weighted average of 26.4%. Similarly, the statistical analysis conducted on geographies consisting of 116,684,213 people shows a poor positive correlation between the proportion of Immigrants from Norway and percentage of family households with children in the United States with a correlation coefficient (R) of 0.118 and weighted average of 26.1%, a difference of 0.92%.
Family Households with Children Correlation Summary
| Measurement | Immigrants from Trinidad and Tobago | Immigrants from Norway |
| Minimum | 15.1% | 6.2% |
| Maximum | 62.8% | 48.4% |
| Range | 47.7% | 42.2% |
| Mean | 27.9% | 24.6% |
| Median | 27.4% | 24.6% |
| Interquartile 25% (IQ1) | 24.1% | 19.8% |
| Interquartile 75% (IQ3) | 30.0% | 28.0% |
| Interquartile Range (IQR) | 5.9% | 8.1% |
| Standard Deviation (Sample) | 7.0% | 9.9% |
| Standard Deviation (Population) | 7.0% | 9.7% |
Demographics Similar to Immigrants from Trinidad and Tobago and Immigrants from Norway by Family Households with Children
In terms of family households with children, the demographic groups most similar to Immigrants from Trinidad and Tobago are Serbian (26.4%, a difference of 0.010%), Paiute (26.4%, a difference of 0.020%), Immigrants from Guyana (26.3%, a difference of 0.040%), Immigrants from Bahamas (26.3%, a difference of 0.090%), and Guyanese (26.3%, a difference of 0.12%). Similarly, the demographic groups most similar to Immigrants from Norway are French Canadian (26.1%, a difference of 0.070%), Estonian (26.1%, a difference of 0.080%), Cree (26.2%, a difference of 0.15%), Ottawa (26.1%, a difference of 0.17%), and Iroquois (26.1%, a difference of 0.21%).
| Demographics | Rating | Rank | Family Households with Children |
| Immigrants | Western Europe | 0.1 /100 | #298 | Tragic 26.4% |
| Trinidadians and Tobagonians | 0.1 /100 | #299 | Tragic 26.4% |
| Paiute | 0.1 /100 | #300 | Tragic 26.4% |
| Immigrants | Trinidad and Tobago | 0.1 /100 | #301 | Tragic 26.4% |
| Serbians | 0.1 /100 | #302 | Tragic 26.4% |
| Immigrants | Guyana | 0.1 /100 | #303 | Tragic 26.3% |
| Immigrants | Bahamas | 0.1 /100 | #304 | Tragic 26.3% |
| Guyanese | 0.1 /100 | #305 | Tragic 26.3% |
| Bermudans | 0.1 /100 | #306 | Tragic 26.3% |
| West Indians | 0.0 /100 | #307 | Tragic 26.3% |
| Lumbee | 0.0 /100 | #308 | Tragic 26.3% |
| Immigrants | Somalia | 0.0 /100 | #309 | Tragic 26.3% |
| Marshallese | 0.0 /100 | #310 | Tragic 26.2% |
| Colville | 0.0 /100 | #311 | Tragic 26.2% |
| Immigrants | Czechoslovakia | 0.0 /100 | #312 | Tragic 26.2% |
| Cree | 0.0 /100 | #313 | Tragic 26.2% |
| French Canadians | 0.0 /100 | #314 | Tragic 26.1% |
| Immigrants | Norway | 0.0 /100 | #315 | Tragic 26.1% |
| Estonians | 0.0 /100 | #316 | Tragic 26.1% |
| Ottawa | 0.0 /100 | #317 | Tragic 26.1% |
| Iroquois | 0.0 /100 | #318 | Tragic 26.1% |