Ecuadorian vs Haitian Family Households with Children
COMPARE
Ecuadorian
Haitian
Family Households with Children
Family Households with Children Comparison
Ecuadorians
Haitians
27.8%
FAMILY HOUSEHOLDS WITH CHILDREN
90.8/ 100
METRIC RATING
125th/ 347
METRIC RANK
27.2%
FAMILY HOUSEHOLDS WITH CHILDREN
19.8/ 100
METRIC RATING
207th/ 347
METRIC RANK
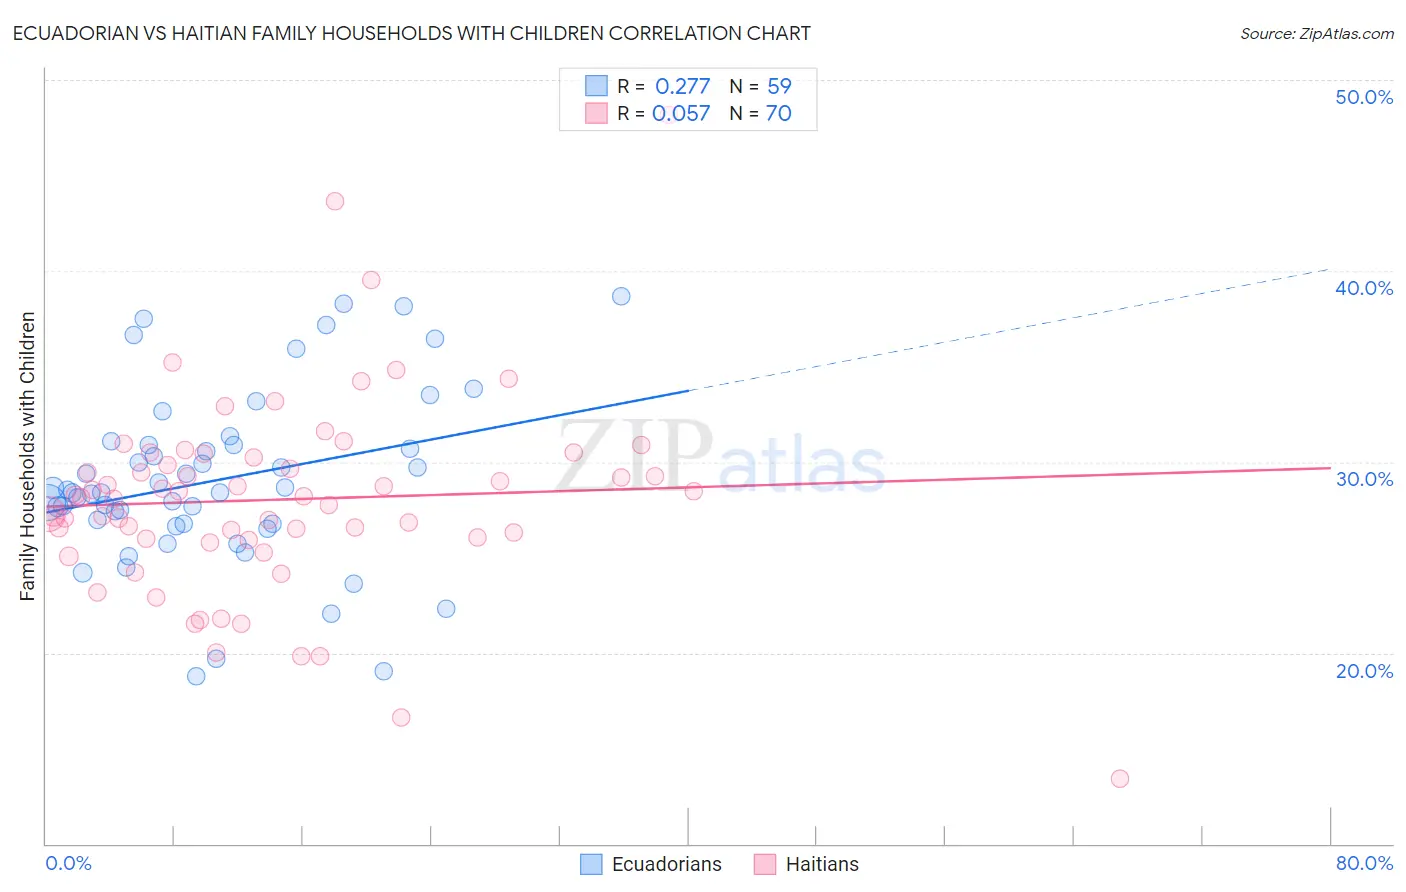
Ecuadorian vs Haitian Family Households with Children Correlation Chart
The statistical analysis conducted on geographies consisting of 317,541,400 people shows a weak positive correlation between the proportion of Ecuadorians and percentage of family households with children in the United States with a correlation coefficient (R) of 0.277 and weighted average of 27.8%. Similarly, the statistical analysis conducted on geographies consisting of 287,598,157 people shows a slight positive correlation between the proportion of Haitians and percentage of family households with children in the United States with a correlation coefficient (R) of 0.057 and weighted average of 27.2%, a difference of 2.1%.
Family Households with Children Correlation Summary
| Measurement | Ecuadorian | Haitian |
| Minimum | 18.8% | 13.4% |
| Maximum | 38.7% | 48.2% |
| Range | 19.9% | 34.8% |
| Mean | 29.0% | 28.0% |
| Median | 28.4% | 28.2% |
| Interquartile 25% (IQ1) | 26.7% | 26.0% |
| Interquartile 75% (IQ3) | 30.9% | 30.2% |
| Interquartile Range (IQR) | 4.1% | 4.2% |
| Standard Deviation (Sample) | 4.6% | 5.3% |
| Standard Deviation (Population) | 4.5% | 5.3% |
Similar Demographics by Family Households with Children
Demographics Similar to Ecuadorians by Family Households with Children
In terms of family households with children, the demographic groups most similar to Ecuadorians are Immigrants from Singapore (27.8%, a difference of 0.0%), Immigrants from Ethiopia (27.8%, a difference of 0.020%), Belizean (27.8%, a difference of 0.050%), Immigrants from Northern Africa (27.8%, a difference of 0.070%), and Syrian (27.8%, a difference of 0.070%).
| Demographics | Rating | Rank | Family Households with Children |
| Central American Indians | 95.9 /100 | #118 | Exceptional 27.9% |
| Zimbabweans | 95.6 /100 | #119 | Exceptional 27.9% |
| Europeans | 95.4 /100 | #120 | Exceptional 27.9% |
| Immigrants | Western Asia | 93.6 /100 | #121 | Exceptional 27.9% |
| Immigrants | Zimbabwe | 92.8 /100 | #122 | Exceptional 27.8% |
| Immigrants | Northern Africa | 91.8 /100 | #123 | Exceptional 27.8% |
| Immigrants | Singapore | 90.8 /100 | #124 | Exceptional 27.8% |
| Ecuadorians | 90.8 /100 | #125 | Exceptional 27.8% |
| Immigrants | Ethiopia | 90.5 /100 | #126 | Exceptional 27.8% |
| Belizeans | 90.0 /100 | #127 | Exceptional 27.8% |
| Syrians | 89.7 /100 | #128 | Excellent 27.8% |
| Immigrants | Eritrea | 89.4 /100 | #129 | Excellent 27.8% |
| Cajuns | 87.6 /100 | #130 | Excellent 27.7% |
| Lebanese | 87.4 /100 | #131 | Excellent 27.7% |
| Immigrants | Belize | 85.7 /100 | #132 | Excellent 27.7% |
Demographics Similar to Haitians by Family Households with Children
In terms of family households with children, the demographic groups most similar to Haitians are Immigrants from Micronesia (27.2%, a difference of 0.010%), Immigrants from Haiti (27.2%, a difference of 0.020%), Immigrants from Sudan (27.3%, a difference of 0.060%), Kiowa (27.3%, a difference of 0.080%), and American (27.3%, a difference of 0.10%).
| Demographics | Rating | Rank | Family Households with Children |
| Immigrants | Congo | 28.7 /100 | #200 | Fair 27.3% |
| Bhutanese | 25.1 /100 | #201 | Fair 27.3% |
| Americans | 22.8 /100 | #202 | Fair 27.3% |
| Kiowa | 22.2 /100 | #203 | Fair 27.3% |
| Immigrants | Sudan | 21.6 /100 | #204 | Fair 27.3% |
| Immigrants | Haiti | 20.3 /100 | #205 | Fair 27.2% |
| Immigrants | Micronesia | 20.2 /100 | #206 | Fair 27.2% |
| Haitians | 19.8 /100 | #207 | Poor 27.2% |
| Immigrants | Poland | 16.4 /100 | #208 | Poor 27.2% |
| Dutch West Indians | 15.8 /100 | #209 | Poor 27.2% |
| Immigrants | Ukraine | 14.4 /100 | #210 | Poor 27.2% |
| Welsh | 14.2 /100 | #211 | Poor 27.2% |
| Immigrants | Dominica | 13.9 /100 | #212 | Poor 27.2% |
| Okinawans | 13.7 /100 | #213 | Poor 27.2% |
| Africans | 13.0 /100 | #214 | Poor 27.2% |