Eastern European vs Immigrants from Korea Births to Unmarried Women
COMPARE
Eastern European
Immigrants from Korea
Births to Unmarried Women
Births to Unmarried Women Comparison
Eastern Europeans
Immigrants from Korea
27.7%
BIRTHS TO UNMARRIED WOMEN
99.5/ 100
METRIC RATING
48th/ 347
METRIC RANK
26.3%
BIRTHS TO UNMARRIED WOMEN
99.9/ 100
METRIC RATING
20th/ 347
METRIC RANK
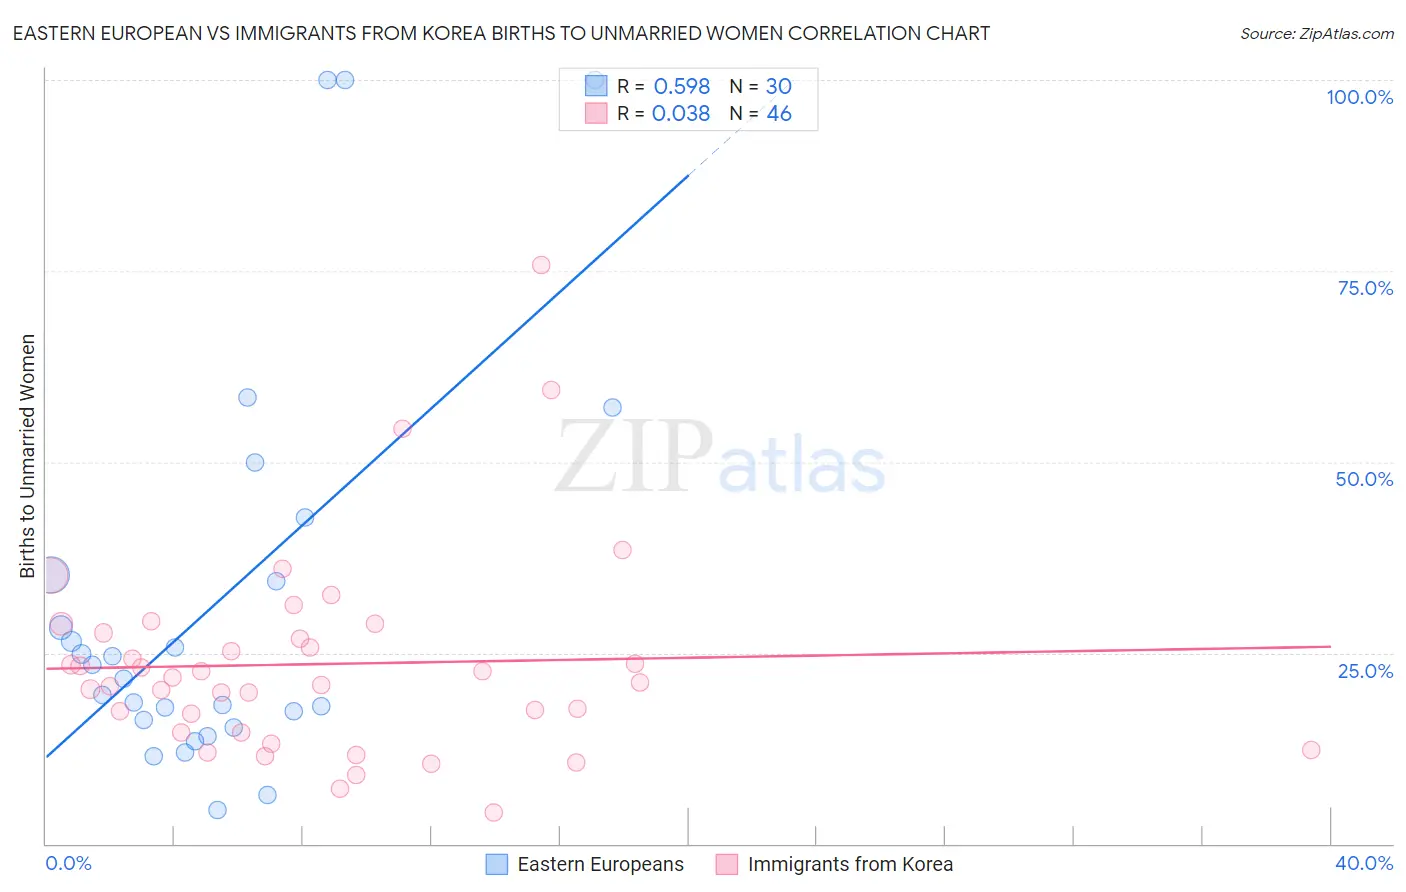
Eastern European vs Immigrants from Korea Births to Unmarried Women Correlation Chart
The statistical analysis conducted on geographies consisting of 419,649,713 people shows a substantial positive correlation between the proportion of Eastern Europeans and percentage of births to unmarried women in the United States with a correlation coefficient (R) of 0.598 and weighted average of 27.7%. Similarly, the statistical analysis conducted on geographies consisting of 385,969,141 people shows no correlation between the proportion of Immigrants from Korea and percentage of births to unmarried women in the United States with a correlation coefficient (R) of 0.038 and weighted average of 26.3%, a difference of 5.6%.
Births to Unmarried Women Correlation Summary
| Measurement | Eastern European | Immigrants from Korea |
| Minimum | 4.4% | 4.1% |
| Maximum | 100.0% | 75.8% |
| Range | 95.6% | 71.7% |
| Mean | 31.8% | 23.5% |
| Median | 22.6% | 21.4% |
| Interquartile 25% (IQ1) | 16.3% | 14.6% |
| Interquartile 75% (IQ3) | 35.2% | 27.6% |
| Interquartile Range (IQR) | 18.9% | 13.0% |
| Standard Deviation (Sample) | 26.7% | 13.3% |
| Standard Deviation (Population) | 26.2% | 13.2% |
Similar Demographics by Births to Unmarried Women
Demographics Similar to Eastern Europeans by Births to Unmarried Women
In terms of births to unmarried women, the demographic groups most similar to Eastern Europeans are Immigrants from Lithuania (27.7%, a difference of 0.010%), Hmong (27.7%, a difference of 0.010%), Latvian (27.7%, a difference of 0.060%), Immigrants from Indonesia (27.7%, a difference of 0.15%), and Immigrants from Greece (27.8%, a difference of 0.19%).
| Demographics | Rating | Rank | Births to Unmarried Women |
| Iraqis | 99.6 /100 | #41 | Exceptional 27.6% |
| Immigrants | Eastern Europe | 99.6 /100 | #42 | Exceptional 27.6% |
| Immigrants | Bulgaria | 99.6 /100 | #43 | Exceptional 27.6% |
| Immigrants | Indonesia | 99.5 /100 | #44 | Exceptional 27.7% |
| Latvians | 99.5 /100 | #45 | Exceptional 27.7% |
| Immigrants | Lithuania | 99.5 /100 | #46 | Exceptional 27.7% |
| Hmong | 99.5 /100 | #47 | Exceptional 27.7% |
| Eastern Europeans | 99.5 /100 | #48 | Exceptional 27.7% |
| Immigrants | Greece | 99.4 /100 | #49 | Exceptional 27.8% |
| Maltese | 99.4 /100 | #50 | Exceptional 27.8% |
| Macedonians | 99.4 /100 | #51 | Exceptional 27.9% |
| Bhutanese | 99.4 /100 | #52 | Exceptional 27.9% |
| Immigrants | Romania | 99.4 /100 | #53 | Exceptional 27.9% |
| Afghans | 99.4 /100 | #54 | Exceptional 27.9% |
| Mongolians | 99.3 /100 | #55 | Exceptional 27.9% |
Demographics Similar to Immigrants from Korea by Births to Unmarried Women
In terms of births to unmarried women, the demographic groups most similar to Immigrants from Korea are Soviet Union (26.3%, a difference of 0.13%), Armenian (26.2%, a difference of 0.21%), Burmese (26.4%, a difference of 0.36%), Immigrants from Japan (26.4%, a difference of 0.55%), and Immigrants from Armenia (26.1%, a difference of 0.80%).
| Demographics | Rating | Rank | Births to Unmarried Women |
| Iranians | 100.0 /100 | #13 | Exceptional 25.3% |
| Immigrants | Lebanon | 100.0 /100 | #14 | Exceptional 25.3% |
| Immigrants | Singapore | 100.0 /100 | #15 | Exceptional 25.6% |
| Immigrants | Belarus | 100.0 /100 | #16 | Exceptional 25.6% |
| Immigrants | Uzbekistan | 100.0 /100 | #17 | Exceptional 25.8% |
| Immigrants | Armenia | 99.9 /100 | #18 | Exceptional 26.1% |
| Armenians | 99.9 /100 | #19 | Exceptional 26.2% |
| Immigrants | Korea | 99.9 /100 | #20 | Exceptional 26.3% |
| Soviet Union | 99.9 /100 | #21 | Exceptional 26.3% |
| Burmese | 99.9 /100 | #22 | Exceptional 26.4% |
| Immigrants | Japan | 99.9 /100 | #23 | Exceptional 26.4% |
| Immigrants | Australia | 99.9 /100 | #24 | Exceptional 26.6% |
| Cambodians | 99.9 /100 | #25 | Exceptional 26.7% |
| Asians | 99.9 /100 | #26 | Exceptional 26.8% |
| Immigrants | Asia | 99.9 /100 | #27 | Exceptional 26.8% |