Dutch vs Immigrants from Micronesia Family Households with Children
COMPARE
Dutch
Immigrants from Micronesia
Family Households with Children
Family Households with Children Comparison
Dutch
Immigrants from Micronesia
27.4%
FAMILY HOUSEHOLDS WITH CHILDREN
38.8/ 100
METRIC RATING
188th/ 347
METRIC RANK
27.2%
FAMILY HOUSEHOLDS WITH CHILDREN
20.2/ 100
METRIC RATING
206th/ 347
METRIC RANK
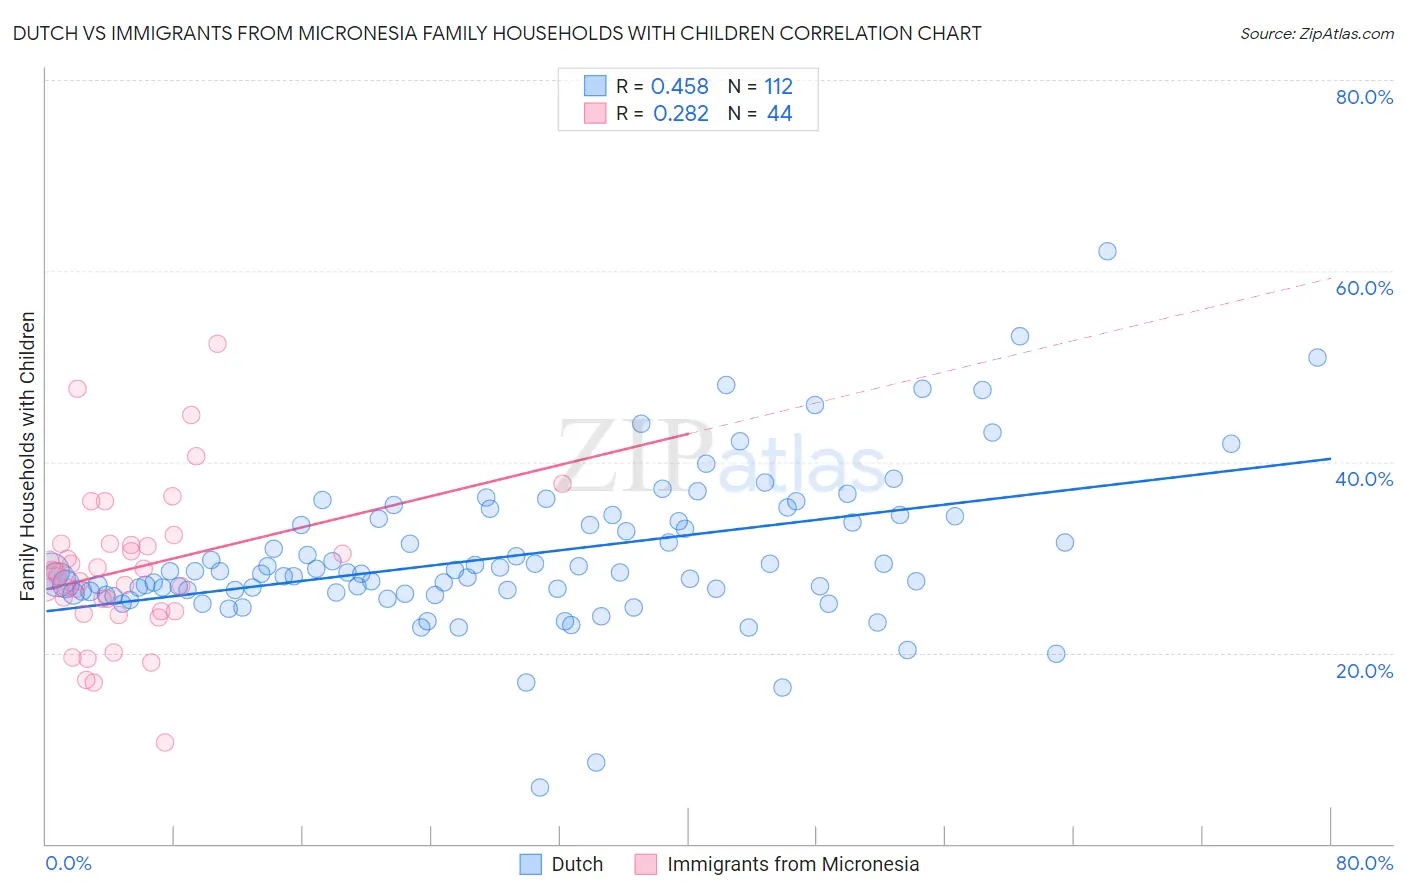
Dutch vs Immigrants from Micronesia Family Households with Children Correlation Chart
The statistical analysis conducted on geographies consisting of 553,510,182 people shows a moderate positive correlation between the proportion of Dutch and percentage of family households with children in the United States with a correlation coefficient (R) of 0.458 and weighted average of 27.4%. Similarly, the statistical analysis conducted on geographies consisting of 61,601,070 people shows a weak positive correlation between the proportion of Immigrants from Micronesia and percentage of family households with children in the United States with a correlation coefficient (R) of 0.282 and weighted average of 27.2%, a difference of 0.51%.
Family Households with Children Correlation Summary
| Measurement | Dutch | Immigrants from Micronesia |
| Minimum | 5.9% | 10.6% |
| Maximum | 62.0% | 52.3% |
| Range | 56.1% | 41.7% |
| Mean | 30.2% | 28.7% |
| Median | 28.4% | 28.3% |
| Interquartile 25% (IQ1) | 26.4% | 24.3% |
| Interquartile 75% (IQ3) | 33.9% | 31.4% |
| Interquartile Range (IQR) | 7.6% | 7.0% |
| Standard Deviation (Sample) | 8.0% | 7.9% |
| Standard Deviation (Population) | 8.0% | 7.9% |
Demographics Similar to Dutch and Immigrants from Micronesia by Family Households with Children
In terms of family households with children, the demographic groups most similar to Dutch are Creek (27.4%, a difference of 0.020%), Immigrants from Israel (27.4%, a difference of 0.020%), Immigrants from Uruguay (27.4%, a difference of 0.030%), Sudanese (27.4%, a difference of 0.030%), and Pennsylvania German (27.4%, a difference of 0.030%). Similarly, the demographic groups most similar to Immigrants from Micronesia are Immigrants from Haiti (27.2%, a difference of 0.0%), Haitian (27.2%, a difference of 0.010%), Immigrants from Sudan (27.3%, a difference of 0.050%), Kiowa (27.3%, a difference of 0.070%), and American (27.3%, a difference of 0.090%).
| Demographics | Rating | Rank | Family Households with Children |
| Creek | 39.8 /100 | #187 | Fair 27.4% |
| Dutch | 38.8 /100 | #188 | Fair 27.4% |
| Immigrants | Israel | 37.9 /100 | #189 | Fair 27.4% |
| Immigrants | Uruguay | 37.7 /100 | #190 | Fair 27.4% |
| Sudanese | 37.6 /100 | #191 | Fair 27.4% |
| Pennsylvania Germans | 37.5 /100 | #192 | Fair 27.4% |
| Swedes | 36.9 /100 | #193 | Fair 27.4% |
| Immigrants | Iran | 36.1 /100 | #194 | Fair 27.4% |
| Crow | 35.7 /100 | #195 | Fair 27.4% |
| Cheyenne | 35.1 /100 | #196 | Fair 27.4% |
| Norwegians | 35.0 /100 | #197 | Fair 27.4% |
| Immigrants | Romania | 34.4 /100 | #198 | Fair 27.4% |
| English | 32.0 /100 | #199 | Fair 27.3% |
| Immigrants | Congo | 28.7 /100 | #200 | Fair 27.3% |
| Bhutanese | 25.1 /100 | #201 | Fair 27.3% |
| Americans | 22.8 /100 | #202 | Fair 27.3% |
| Kiowa | 22.2 /100 | #203 | Fair 27.3% |
| Immigrants | Sudan | 21.6 /100 | #204 | Fair 27.3% |
| Immigrants | Haiti | 20.3 /100 | #205 | Fair 27.2% |
| Immigrants | Micronesia | 20.2 /100 | #206 | Fair 27.2% |
| Haitians | 19.8 /100 | #207 | Poor 27.2% |