Dutch vs Cree Single Mother Households
COMPARE
Dutch
Cree
Single Mother Households
Single Mother Households Comparison
Dutch
Cree
5.8%
SINGLE MOTHER HOUSEHOLDS
95.1/ 100
METRIC RATING
114th/ 347
METRIC RANK
6.7%
SINGLE MOTHER HOUSEHOLDS
11.9/ 100
METRIC RATING
205th/ 347
METRIC RANK
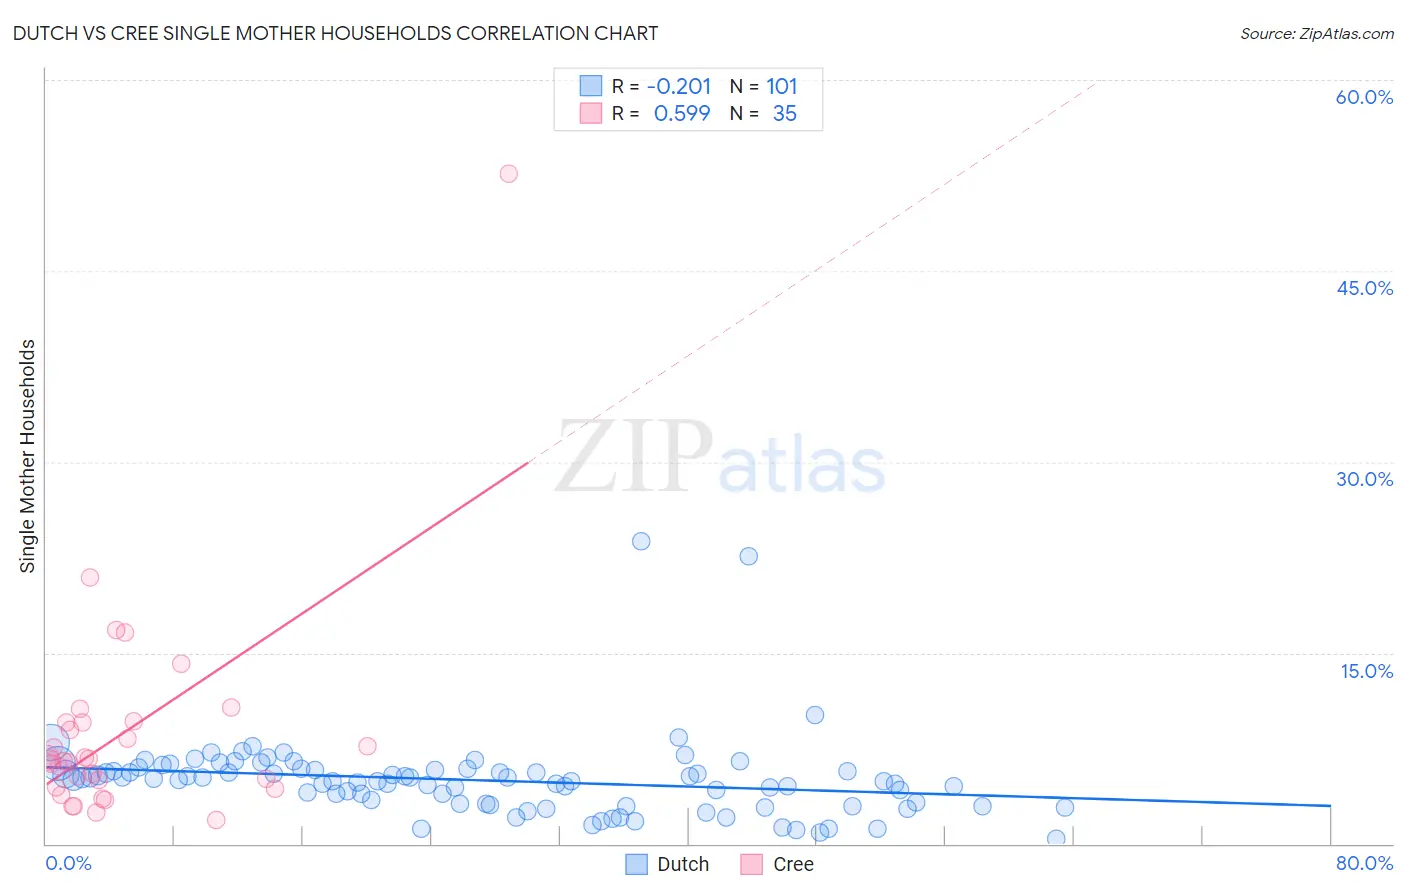
Dutch vs Cree Single Mother Households Correlation Chart
The statistical analysis conducted on geographies consisting of 549,817,585 people shows a weak negative correlation between the proportion of Dutch and percentage of single mother households in the United States with a correlation coefficient (R) of -0.201 and weighted average of 5.8%. Similarly, the statistical analysis conducted on geographies consisting of 76,173,088 people shows a substantial positive correlation between the proportion of Cree and percentage of single mother households in the United States with a correlation coefficient (R) of 0.599 and weighted average of 6.7%, a difference of 14.8%.
Single Mother Households Correlation Summary
| Measurement | Dutch | Cree |
| Minimum | 0.36% | 1.9% |
| Maximum | 23.8% | 52.6% |
| Range | 23.4% | 50.8% |
| Mean | 5.0% | 8.7% |
| Median | 5.0% | 6.6% |
| Interquartile 25% (IQ1) | 3.1% | 4.4% |
| Interquartile 75% (IQ3) | 5.8% | 9.5% |
| Interquartile Range (IQR) | 2.7% | 5.1% |
| Standard Deviation (Sample) | 3.2% | 8.7% |
| Standard Deviation (Population) | 3.2% | 8.6% |
Similar Demographics by Single Mother Households
Demographics Similar to Dutch by Single Mother Households
In terms of single mother households, the demographic groups most similar to Dutch are Mongolian (5.8%, a difference of 0.13%), Irish (5.8%, a difference of 0.19%), Immigrants from Kuwait (5.8%, a difference of 0.20%), Immigrants from England (5.8%, a difference of 0.24%), and Pennsylvania German (5.8%, a difference of 0.25%).
| Demographics | Rating | Rank | Single Mother Households |
| Paraguayans | 95.8 /100 | #107 | Exceptional 5.8% |
| Immigrants | Italy | 95.8 /100 | #108 | Exceptional 5.8% |
| Immigrants | Western Europe | 95.7 /100 | #109 | Exceptional 5.8% |
| British | 95.5 /100 | #110 | Exceptional 5.8% |
| Immigrants | England | 95.5 /100 | #111 | Exceptional 5.8% |
| Immigrants | Kuwait | 95.4 /100 | #112 | Exceptional 5.8% |
| Mongolians | 95.3 /100 | #113 | Exceptional 5.8% |
| Dutch | 95.1 /100 | #114 | Exceptional 5.8% |
| Irish | 94.8 /100 | #115 | Exceptional 5.8% |
| Pennsylvania Germans | 94.7 /100 | #116 | Exceptional 5.8% |
| Bolivians | 94.6 /100 | #117 | Exceptional 5.8% |
| Laotians | 94.3 /100 | #118 | Exceptional 5.8% |
| South Africans | 94.1 /100 | #119 | Exceptional 5.8% |
| Tongans | 93.7 /100 | #120 | Exceptional 5.8% |
| Argentineans | 93.7 /100 | #121 | Exceptional 5.8% |
Demographics Similar to Cree by Single Mother Households
In terms of single mother households, the demographic groups most similar to Cree are Immigrants from Fiji (6.7%, a difference of 0.020%), Immigrants from Peru (6.7%, a difference of 0.030%), German Russian (6.7%, a difference of 0.080%), Immigrants from South America (6.7%, a difference of 0.080%), and Guamanian/Chamorro (6.6%, a difference of 0.13%).
| Demographics | Rating | Rank | Single Mother Households |
| Hawaiians | 16.1 /100 | #198 | Poor 6.6% |
| Potawatomi | 15.5 /100 | #199 | Poor 6.6% |
| Immigrants | Ethiopia | 14.7 /100 | #200 | Poor 6.6% |
| Venezuelans | 12.9 /100 | #201 | Poor 6.6% |
| Guamanians/Chamorros | 12.4 /100 | #202 | Poor 6.6% |
| Immigrants | Peru | 12.0 /100 | #203 | Poor 6.7% |
| Immigrants | Fiji | 11.9 /100 | #204 | Poor 6.7% |
| Cree | 11.9 /100 | #205 | Poor 6.7% |
| German Russians | 11.5 /100 | #206 | Poor 6.7% |
| Immigrants | South America | 11.5 /100 | #207 | Poor 6.7% |
| Vietnamese | 11.3 /100 | #208 | Poor 6.7% |
| Immigrants | Colombia | 10.5 /100 | #209 | Poor 6.7% |
| Immigrants | Nonimmigrants | 10.4 /100 | #210 | Poor 6.7% |
| Immigrants | Venezuela | 8.5 /100 | #211 | Tragic 6.7% |
| Immigrants | Eritrea | 8.4 /100 | #212 | Tragic 6.7% |