Danish vs European Disability Age 65 to 74
COMPARE
Danish
European
Disability Age 65 to 74
Disability Age 65 to 74 Comparison
Danes
Europeans
22.8%
DISABILITY AGE 65 TO 74
84.4/ 100
METRIC RATING
144th/ 347
METRIC RANK
23.2%
DISABILITY AGE 65 TO 74
61.2/ 100
METRIC RATING
162nd/ 347
METRIC RANK
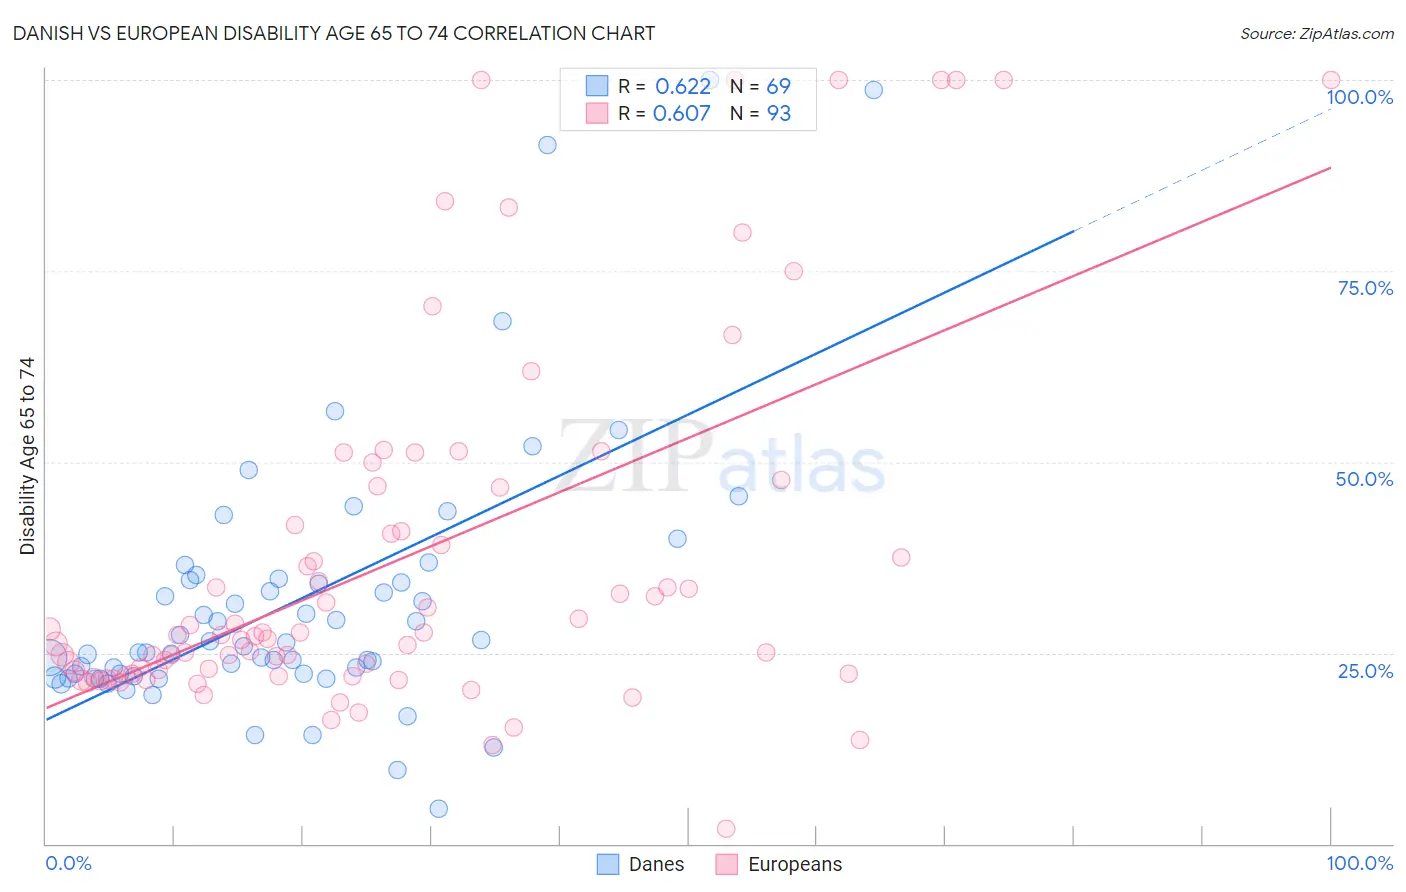
Danish vs European Disability Age 65 to 74 Correlation Chart
The statistical analysis conducted on geographies consisting of 473,096,184 people shows a significant positive correlation between the proportion of Danes and percentage of population with a disability between the ages 65 and 75 in the United States with a correlation coefficient (R) of 0.622 and weighted average of 22.8%. Similarly, the statistical analysis conducted on geographies consisting of 559,638,797 people shows a significant positive correlation between the proportion of Europeans and percentage of population with a disability between the ages 65 and 75 in the United States with a correlation coefficient (R) of 0.607 and weighted average of 23.2%, a difference of 1.8%.
Disability Age 65 to 74 Correlation Summary
| Measurement | Danish | European |
| Minimum | 4.7% | 2.0% |
| Maximum | 100.0% | 100.0% |
| Range | 95.3% | 98.0% |
| Mean | 31.7% | 37.1% |
| Median | 25.8% | 27.4% |
| Interquartile 25% (IQ1) | 22.1% | 22.2% |
| Interquartile 75% (IQ3) | 34.6% | 44.2% |
| Interquartile Range (IQR) | 12.5% | 22.0% |
| Standard Deviation (Sample) | 17.8% | 23.8% |
| Standard Deviation (Population) | 17.7% | 23.7% |
Demographics Similar to Danes and Europeans by Disability Age 65 to 74
In terms of disability age 65 to 74, the demographic groups most similar to Danes are Arab (22.8%, a difference of 0.040%), Immigrants from Uganda (22.8%, a difference of 0.040%), Alsatian (22.8%, a difference of 0.070%), Immigrants from Uzbekistan (22.8%, a difference of 0.14%), and New Zealander (22.9%, a difference of 0.46%). Similarly, the demographic groups most similar to Europeans are Immigrants from Philippines (23.2%, a difference of 0.0%), Immigrants from Cameroon (23.1%, a difference of 0.16%), Korean (23.1%, a difference of 0.18%), South American Indian (23.1%, a difference of 0.27%), and Immigrants from Vietnam (23.1%, a difference of 0.52%).
| Demographics | Rating | Rank | Disability Age 65 to 74 |
| Arabs | 84.8 /100 | #143 | Excellent 22.8% |
| Danes | 84.4 /100 | #144 | Excellent 22.8% |
| Immigrants | Uganda | 84.0 /100 | #145 | Excellent 22.8% |
| Alsatians | 83.7 /100 | #146 | Excellent 22.8% |
| Immigrants | Uzbekistan | 83.1 /100 | #147 | Excellent 22.8% |
| New Zealanders | 79.9 /100 | #148 | Good 22.9% |
| Swiss | 79.7 /100 | #149 | Good 22.9% |
| Canadians | 77.7 /100 | #150 | Good 22.9% |
| Immigrants | Morocco | 77.6 /100 | #151 | Good 22.9% |
| Finns | 76.5 /100 | #152 | Good 22.9% |
| Slavs | 75.2 /100 | #153 | Good 23.0% |
| Sri Lankans | 74.0 /100 | #154 | Good 23.0% |
| British | 73.9 /100 | #155 | Good 23.0% |
| Immigrants | Western Asia | 73.8 /100 | #156 | Good 23.0% |
| Czechoslovakians | 72.4 /100 | #157 | Good 23.0% |
| Immigrants | Vietnam | 69.1 /100 | #158 | Good 23.1% |
| South American Indians | 65.5 /100 | #159 | Good 23.1% |
| Koreans | 64.2 /100 | #160 | Good 23.1% |
| Immigrants | Cameroon | 63.8 /100 | #161 | Good 23.1% |
| Europeans | 61.2 /100 | #162 | Good 23.2% |
| Immigrants | Philippines | 61.1 /100 | #163 | Good 23.2% |