Immigrants from Spain vs European Single Father Households
COMPARE
Immigrants from Spain
European
Single Father Households
Single Father Households Comparison
Immigrants from Spain
Europeans
2.1%
SINGLE FATHER HOUSEHOLDS
99.8/ 100
METRIC RATING
72nd/ 347
METRIC RANK
2.3%
SINGLE FATHER HOUSEHOLDS
80.9/ 100
METRIC RATING
155th/ 347
METRIC RANK
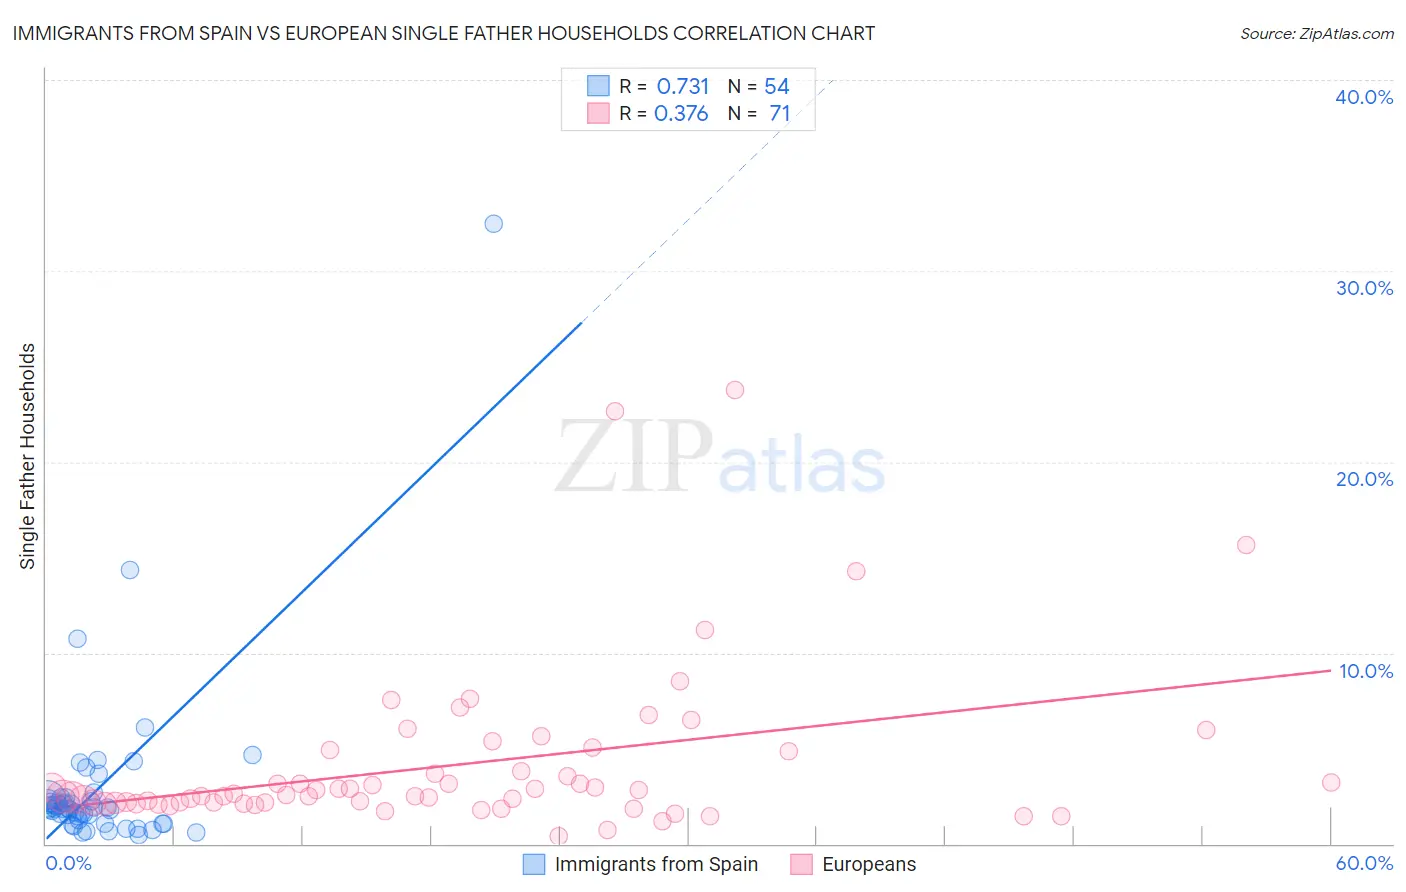
Immigrants from Spain vs European Single Father Households Correlation Chart
The statistical analysis conducted on geographies consisting of 238,550,854 people shows a strong positive correlation between the proportion of Immigrants from Spain and percentage of single father households in the United States with a correlation coefficient (R) of 0.731 and weighted average of 2.1%. Similarly, the statistical analysis conducted on geographies consisting of 548,404,075 people shows a mild positive correlation between the proportion of Europeans and percentage of single father households in the United States with a correlation coefficient (R) of 0.376 and weighted average of 2.3%, a difference of 10.1%.
Single Father Households Correlation Summary
| Measurement | Immigrants from Spain | European |
| Minimum | 0.45% | 0.42% |
| Maximum | 32.5% | 23.7% |
| Range | 32.0% | 23.3% |
| Mean | 2.9% | 4.1% |
| Median | 1.9% | 2.5% |
| Interquartile 25% (IQ1) | 1.3% | 2.1% |
| Interquartile 75% (IQ3) | 2.4% | 4.8% |
| Interquartile Range (IQR) | 1.1% | 2.7% |
| Standard Deviation (Sample) | 4.7% | 4.3% |
| Standard Deviation (Population) | 4.7% | 4.2% |
Similar Demographics by Single Father Households
Demographics Similar to Immigrants from Spain by Single Father Households
In terms of single father households, the demographic groups most similar to Immigrants from Spain are Immigrants from Kuwait (2.1%, a difference of 0.0%), Egyptian (2.1%, a difference of 0.020%), Immigrants from Bangladesh (2.1%, a difference of 0.14%), Immigrants from Egypt (2.1%, a difference of 0.15%), and Immigrants from Romania (2.1%, a difference of 0.22%).
| Demographics | Rating | Rank | Single Father Households |
| Paraguayans | 99.9 /100 | #65 | Exceptional 2.1% |
| Immigrants | Western Asia | 99.8 /100 | #66 | Exceptional 2.1% |
| Immigrants | Italy | 99.8 /100 | #67 | Exceptional 2.1% |
| Immigrants | Denmark | 99.8 /100 | #68 | Exceptional 2.1% |
| Immigrants | Romania | 99.8 /100 | #69 | Exceptional 2.1% |
| Egyptians | 99.8 /100 | #70 | Exceptional 2.1% |
| Immigrants | Kuwait | 99.8 /100 | #71 | Exceptional 2.1% |
| Immigrants | Spain | 99.8 /100 | #72 | Exceptional 2.1% |
| Immigrants | Bangladesh | 99.8 /100 | #73 | Exceptional 2.1% |
| Immigrants | Egypt | 99.8 /100 | #74 | Exceptional 2.1% |
| Immigrants | Sweden | 99.8 /100 | #75 | Exceptional 2.1% |
| Immigrants | Scotland | 99.8 /100 | #76 | Exceptional 2.1% |
| Immigrants | Saudi Arabia | 99.8 /100 | #77 | Exceptional 2.1% |
| Estonians | 99.7 /100 | #78 | Exceptional 2.1% |
| Immigrants | Asia | 99.7 /100 | #79 | Exceptional 2.1% |
Demographics Similar to Europeans by Single Father Households
In terms of single father households, the demographic groups most similar to Europeans are Bolivian (2.3%, a difference of 0.020%), Immigrants from South America (2.3%, a difference of 0.12%), Canadian (2.3%, a difference of 0.14%), Immigrants from Senegal (2.3%, a difference of 0.17%), and Immigrants from Germany (2.3%, a difference of 0.24%).
| Demographics | Rating | Rank | Single Father Households |
| South American Indians | 88.5 /100 | #148 | Excellent 2.3% |
| Senegalese | 88.4 /100 | #149 | Excellent 2.3% |
| Venezuelans | 86.2 /100 | #150 | Excellent 2.3% |
| Immigrants | Syria | 84.8 /100 | #151 | Excellent 2.3% |
| Immigrants | Venezuela | 83.2 /100 | #152 | Excellent 2.3% |
| Immigrants | Germany | 82.8 /100 | #153 | Excellent 2.3% |
| Bolivians | 81.0 /100 | #154 | Excellent 2.3% |
| Europeans | 80.9 /100 | #155 | Excellent 2.3% |
| Immigrants | South America | 79.9 /100 | #156 | Good 2.3% |
| Canadians | 79.7 /100 | #157 | Good 2.3% |
| Immigrants | Senegal | 79.4 /100 | #158 | Good 2.3% |
| Immigrants | West Indies | 77.9 /100 | #159 | Good 2.3% |
| Immigrants | Bolivia | 76.3 /100 | #160 | Good 2.3% |
| Swiss | 73.2 /100 | #161 | Good 2.3% |
| Scottish | 72.8 /100 | #162 | Good 2.3% |