Cuban vs Immigrants from Jamaica Divorced or Separated
COMPARE
Cuban
Immigrants from Jamaica
Divorced or Separated
Divorced or Separated Comparison
Cubans
Immigrants from Jamaica
14.5%
DIVORCED OR SEPARATED
0.0/ 100
METRIC RATING
344th/ 347
METRIC RANK
13.0%
DIVORCED OR SEPARATED
0.0/ 100
METRIC RATING
299th/ 347
METRIC RANK
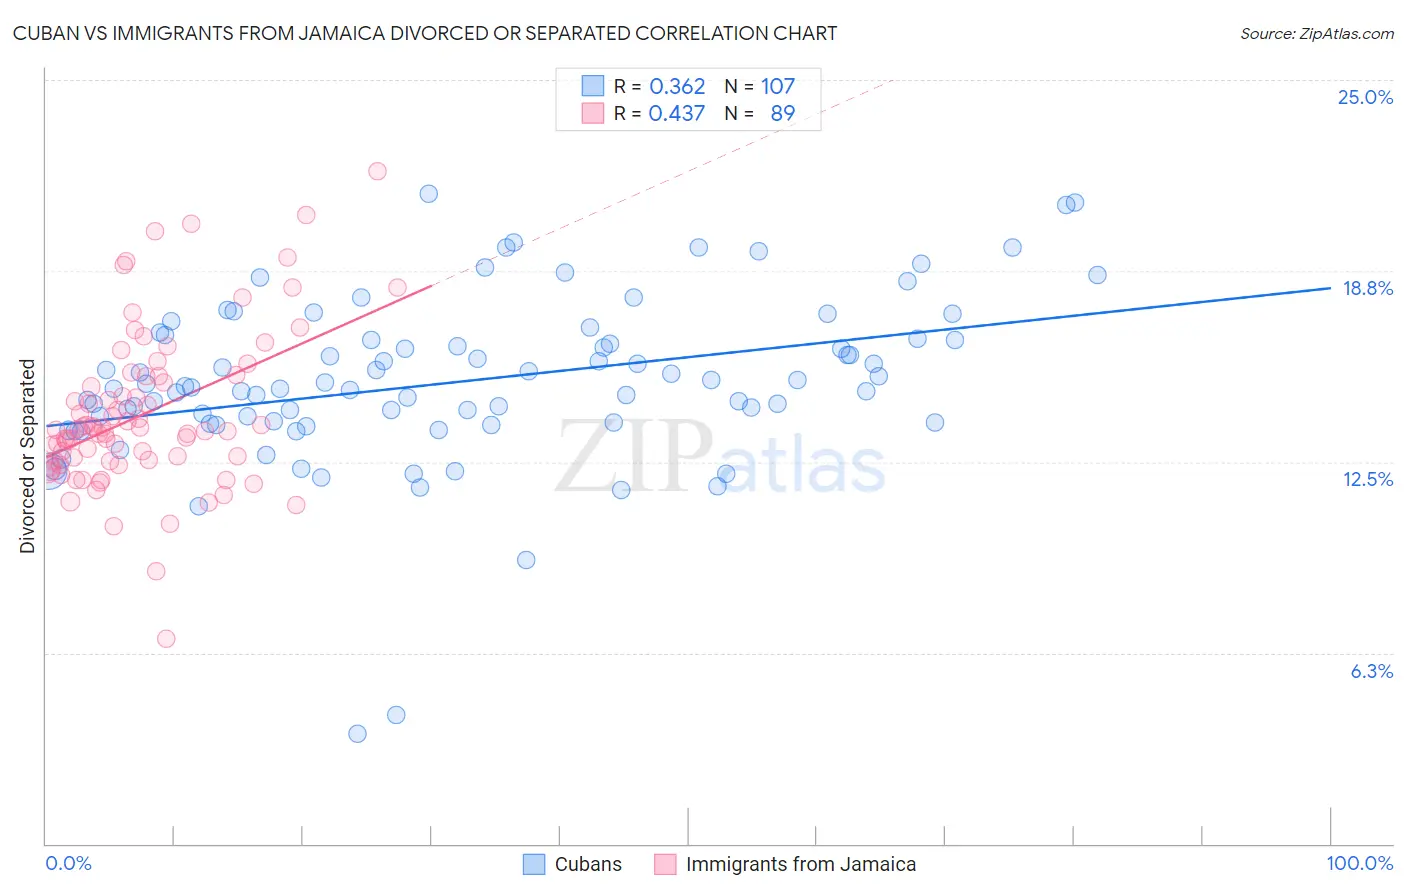
Cuban vs Immigrants from Jamaica Divorced or Separated Correlation Chart
The statistical analysis conducted on geographies consisting of 449,144,755 people shows a mild positive correlation between the proportion of Cubans and percentage of population currently divorced or separated in the United States with a correlation coefficient (R) of 0.362 and weighted average of 14.5%. Similarly, the statistical analysis conducted on geographies consisting of 301,696,834 people shows a moderate positive correlation between the proportion of Immigrants from Jamaica and percentage of population currently divorced or separated in the United States with a correlation coefficient (R) of 0.437 and weighted average of 13.0%, a difference of 11.4%.
Divorced or Separated Correlation Summary
| Measurement | Cuban | Immigrants from Jamaica |
| Minimum | 3.6% | 6.7% |
| Maximum | 21.3% | 22.0% |
| Range | 17.7% | 15.3% |
| Mean | 15.1% | 14.1% |
| Median | 14.9% | 13.6% |
| Interquartile 25% (IQ1) | 13.8% | 12.5% |
| Interquartile 75% (IQ3) | 16.5% | 15.3% |
| Interquartile Range (IQR) | 2.7% | 2.8% |
| Standard Deviation (Sample) | 2.8% | 2.6% |
| Standard Deviation (Population) | 2.7% | 2.6% |
Similar Demographics by Divorced or Separated
Demographics Similar to Cubans by Divorced or Separated
In terms of divorced or separated, the demographic groups most similar to Cubans are Kiowa (14.5%, a difference of 0.10%), Creek (14.4%, a difference of 0.68%), Seminole (14.3%, a difference of 1.7%), Bahamian (14.2%, a difference of 1.9%), and Chickasaw (14.2%, a difference of 2.1%).
| Demographics | Rating | Rank | Divorced or Separated |
| Puerto Ricans | 0.0 /100 | #333 | Tragic 13.9% |
| Immigrants | Bahamas | 0.0 /100 | #334 | Tragic 13.9% |
| Dutch West Indians | 0.0 /100 | #335 | Tragic 14.0% |
| Shoshone | 0.0 /100 | #336 | Tragic 14.0% |
| Crow | 0.0 /100 | #337 | Tragic 14.1% |
| Choctaw | 0.0 /100 | #338 | Tragic 14.1% |
| Colville | 0.0 /100 | #339 | Tragic 14.2% |
| Chickasaw | 0.0 /100 | #340 | Tragic 14.2% |
| Bahamians | 0.0 /100 | #341 | Tragic 14.2% |
| Seminole | 0.0 /100 | #342 | Tragic 14.3% |
| Creek | 0.0 /100 | #343 | Tragic 14.4% |
| Cubans | 0.0 /100 | #344 | Tragic 14.5% |
| Kiowa | 0.0 /100 | #345 | Tragic 14.5% |
| Arapaho | 0.0 /100 | #346 | Tragic 14.8% |
| Immigrants | Cuba | 0.0 /100 | #347 | Tragic 15.2% |
Demographics Similar to Immigrants from Jamaica by Divorced or Separated
In terms of divorced or separated, the demographic groups most similar to Immigrants from Jamaica are Venezuelan (13.0%, a difference of 0.040%), Native/Alaskan (13.0%, a difference of 0.10%), Nicaraguan (13.0%, a difference of 0.16%), Immigrants from Cabo Verde (13.1%, a difference of 0.55%), and Celtic (13.0%, a difference of 0.57%).
| Demographics | Rating | Rank | Divorced or Separated |
| Scotch-Irish | 0.0 /100 | #292 | Tragic 12.9% |
| Jamaicans | 0.0 /100 | #293 | Tragic 12.9% |
| Apache | 0.0 /100 | #294 | Tragic 12.9% |
| Celtics | 0.0 /100 | #295 | Tragic 13.0% |
| Nicaraguans | 0.0 /100 | #296 | Tragic 13.0% |
| Natives/Alaskans | 0.0 /100 | #297 | Tragic 13.0% |
| Venezuelans | 0.0 /100 | #298 | Tragic 13.0% |
| Immigrants | Jamaica | 0.0 /100 | #299 | Tragic 13.0% |
| Immigrants | Cabo Verde | 0.0 /100 | #300 | Tragic 13.1% |
| Alaskan Athabascans | 0.0 /100 | #301 | Tragic 13.1% |
| Immigrants | Venezuela | 0.0 /100 | #302 | Tragic 13.1% |
| Cape Verdeans | 0.0 /100 | #303 | Tragic 13.1% |
| Hopi | 0.0 /100 | #304 | Tragic 13.2% |
| Chippewa | 0.0 /100 | #305 | Tragic 13.2% |
| Tlingit-Haida | 0.0 /100 | #306 | Tragic 13.2% |