Immigrants from Cuba vs Austrian Divorced or Separated
COMPARE
Immigrants from Cuba
Austrian
Divorced or Separated
Divorced or Separated Comparison
Immigrants from Cuba
Austrians
15.2%
DIVORCED OR SEPARATED
0.0/ 100
METRIC RATING
347th/ 347
METRIC RANK
12.0%
DIVORCED OR SEPARATED
72.2/ 100
METRIC RATING
153rd/ 347
METRIC RANK
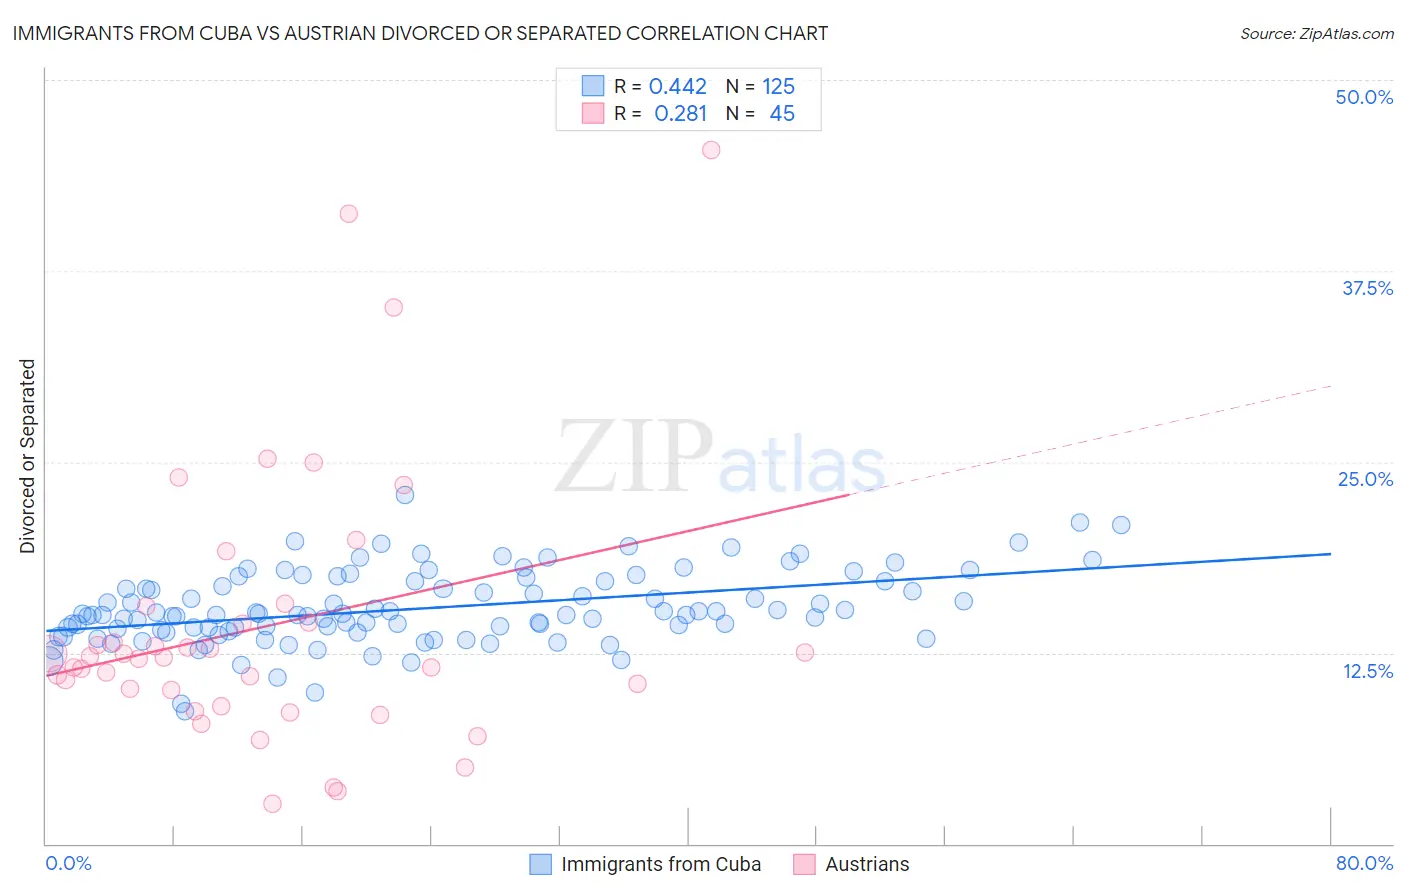
Immigrants from Cuba vs Austrian Divorced or Separated Correlation Chart
The statistical analysis conducted on geographies consisting of 325,985,435 people shows a moderate positive correlation between the proportion of Immigrants from Cuba and percentage of population currently divorced or separated in the United States with a correlation coefficient (R) of 0.442 and weighted average of 15.2%. Similarly, the statistical analysis conducted on geographies consisting of 451,875,003 people shows a weak positive correlation between the proportion of Austrians and percentage of population currently divorced or separated in the United States with a correlation coefficient (R) of 0.281 and weighted average of 12.0%, a difference of 27.4%.
Divorced or Separated Correlation Summary
| Measurement | Immigrants from Cuba | Austrian |
| Minimum | 8.7% | 2.6% |
| Maximum | 22.8% | 45.4% |
| Range | 14.1% | 42.8% |
| Mean | 15.4% | 14.2% |
| Median | 15.0% | 12.2% |
| Interquartile 25% (IQ1) | 14.0% | 9.5% |
| Interquartile 75% (IQ3) | 17.2% | 15.0% |
| Interquartile Range (IQR) | 3.2% | 5.5% |
| Standard Deviation (Sample) | 2.4% | 8.9% |
| Standard Deviation (Population) | 2.4% | 8.8% |
Similar Demographics by Divorced or Separated
Demographics Similar to Immigrants from Cuba by Divorced or Separated
In terms of divorced or separated, the demographic groups most similar to Immigrants from Cuba are Arapaho (14.8%, a difference of 2.8%), Kiowa (14.5%, a difference of 4.9%), Cuban (14.5%, a difference of 5.0%), Creek (14.4%, a difference of 5.7%), and Seminole (14.3%, a difference of 6.8%).
| Demographics | Rating | Rank | Divorced or Separated |
| Puerto Ricans | 0.0 /100 | #333 | Tragic 13.9% |
| Immigrants | Bahamas | 0.0 /100 | #334 | Tragic 13.9% |
| Dutch West Indians | 0.0 /100 | #335 | Tragic 14.0% |
| Shoshone | 0.0 /100 | #336 | Tragic 14.0% |
| Crow | 0.0 /100 | #337 | Tragic 14.1% |
| Choctaw | 0.0 /100 | #338 | Tragic 14.1% |
| Colville | 0.0 /100 | #339 | Tragic 14.2% |
| Chickasaw | 0.0 /100 | #340 | Tragic 14.2% |
| Bahamians | 0.0 /100 | #341 | Tragic 14.2% |
| Seminole | 0.0 /100 | #342 | Tragic 14.3% |
| Creek | 0.0 /100 | #343 | Tragic 14.4% |
| Cubans | 0.0 /100 | #344 | Tragic 14.5% |
| Kiowa | 0.0 /100 | #345 | Tragic 14.5% |
| Arapaho | 0.0 /100 | #346 | Tragic 14.8% |
| Immigrants | Cuba | 0.0 /100 | #347 | Tragic 15.2% |
Demographics Similar to Austrians by Divorced or Separated
In terms of divorced or separated, the demographic groups most similar to Austrians are Chilean (12.0%, a difference of 0.040%), Japanese (12.0%, a difference of 0.060%), Immigrants from Hungary (11.9%, a difference of 0.070%), Hungarian (12.0%, a difference of 0.080%), and Immigrants from Brazil (12.0%, a difference of 0.14%).
| Demographics | Rating | Rank | Divorced or Separated |
| Immigrants | Grenada | 79.1 /100 | #146 | Good 11.9% |
| Poles | 78.6 /100 | #147 | Good 11.9% |
| Italians | 77.8 /100 | #148 | Good 11.9% |
| Immigrants | Oceania | 77.7 /100 | #149 | Good 11.9% |
| Immigrants | Portugal | 77.3 /100 | #150 | Good 11.9% |
| Czechs | 76.4 /100 | #151 | Good 11.9% |
| Immigrants | Hungary | 73.7 /100 | #152 | Good 11.9% |
| Austrians | 72.2 /100 | #153 | Good 12.0% |
| Chileans | 71.3 /100 | #154 | Good 12.0% |
| Japanese | 70.9 /100 | #155 | Good 12.0% |
| Hungarians | 70.3 /100 | #156 | Good 12.0% |
| Immigrants | Brazil | 68.8 /100 | #157 | Good 12.0% |
| Icelanders | 66.0 /100 | #158 | Good 12.0% |
| Immigrants | Barbados | 66.0 /100 | #159 | Good 12.0% |
| Immigrants | Scotland | 65.8 /100 | #160 | Good 12.0% |