Crow vs Immigrants from Micronesia Family Households with Children
COMPARE
Crow
Immigrants from Micronesia
Family Households with Children
Family Households with Children Comparison
Crow
Immigrants from Micronesia
27.4%
FAMILY HOUSEHOLDS WITH CHILDREN
35.7/ 100
METRIC RATING
195th/ 347
METRIC RANK
27.2%
FAMILY HOUSEHOLDS WITH CHILDREN
20.2/ 100
METRIC RATING
206th/ 347
METRIC RANK
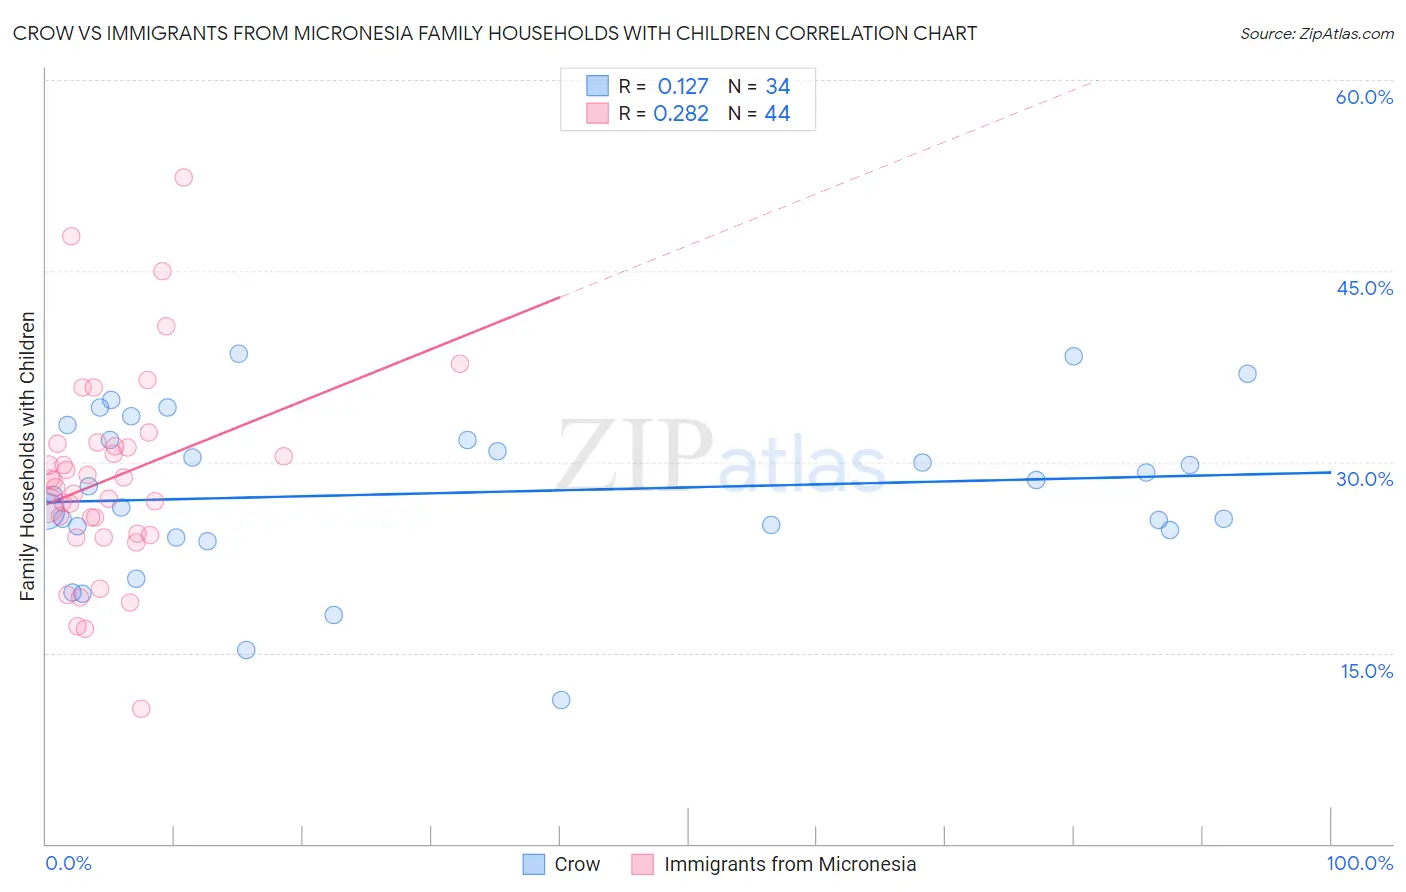
Crow vs Immigrants from Micronesia Family Households with Children Correlation Chart
The statistical analysis conducted on geographies consisting of 59,201,015 people shows a poor positive correlation between the proportion of Crow and percentage of family households with children in the United States with a correlation coefficient (R) of 0.127 and weighted average of 27.4%. Similarly, the statistical analysis conducted on geographies consisting of 61,601,070 people shows a weak positive correlation between the proportion of Immigrants from Micronesia and percentage of family households with children in the United States with a correlation coefficient (R) of 0.282 and weighted average of 27.2%, a difference of 0.44%.
Family Households with Children Correlation Summary
| Measurement | Crow | Immigrants from Micronesia |
| Minimum | 11.3% | 10.6% |
| Maximum | 38.5% | 52.3% |
| Range | 27.2% | 41.7% |
| Mean | 27.6% | 28.7% |
| Median | 27.7% | 28.3% |
| Interquartile 25% (IQ1) | 24.7% | 24.3% |
| Interquartile 75% (IQ3) | 31.7% | 31.4% |
| Interquartile Range (IQR) | 7.1% | 7.0% |
| Standard Deviation (Sample) | 6.4% | 7.9% |
| Standard Deviation (Population) | 6.3% | 7.9% |
Demographics Similar to Crow and Immigrants from Micronesia by Family Households with Children
In terms of family households with children, the demographic groups most similar to Crow are Immigrants from Iran (27.4%, a difference of 0.010%), Cheyenne (27.4%, a difference of 0.020%), Norwegian (27.4%, a difference of 0.020%), Swedish (27.4%, a difference of 0.030%), and Immigrants from Romania (27.4%, a difference of 0.030%). Similarly, the demographic groups most similar to Immigrants from Micronesia are Immigrants from Haiti (27.2%, a difference of 0.0%), Haitian (27.2%, a difference of 0.010%), Immigrants from Sudan (27.3%, a difference of 0.050%), Kiowa (27.3%, a difference of 0.070%), and American (27.3%, a difference of 0.090%).
| Demographics | Rating | Rank | Family Households with Children |
| Immigrants | Uruguay | 37.7 /100 | #190 | Fair 27.4% |
| Sudanese | 37.6 /100 | #191 | Fair 27.4% |
| Pennsylvania Germans | 37.5 /100 | #192 | Fair 27.4% |
| Swedes | 36.9 /100 | #193 | Fair 27.4% |
| Immigrants | Iran | 36.1 /100 | #194 | Fair 27.4% |
| Crow | 35.7 /100 | #195 | Fair 27.4% |
| Cheyenne | 35.1 /100 | #196 | Fair 27.4% |
| Norwegians | 35.0 /100 | #197 | Fair 27.4% |
| Immigrants | Romania | 34.4 /100 | #198 | Fair 27.4% |
| English | 32.0 /100 | #199 | Fair 27.3% |
| Immigrants | Congo | 28.7 /100 | #200 | Fair 27.3% |
| Bhutanese | 25.1 /100 | #201 | Fair 27.3% |
| Americans | 22.8 /100 | #202 | Fair 27.3% |
| Kiowa | 22.2 /100 | #203 | Fair 27.3% |
| Immigrants | Sudan | 21.6 /100 | #204 | Fair 27.3% |
| Immigrants | Haiti | 20.3 /100 | #205 | Fair 27.2% |
| Immigrants | Micronesia | 20.2 /100 | #206 | Fair 27.2% |
| Haitians | 19.8 /100 | #207 | Poor 27.2% |
| Immigrants | Poland | 16.4 /100 | #208 | Poor 27.2% |
| Dutch West Indians | 15.8 /100 | #209 | Poor 27.2% |
| Immigrants | Ukraine | 14.4 /100 | #210 | Poor 27.2% |