Pima vs Immigrants from Micronesia Family Households with Children
COMPARE
Pima
Immigrants from Micronesia
Family Households with Children
Family Households with Children Comparison
Pima
Immigrants from Micronesia
27.1%
FAMILY HOUSEHOLDS WITH CHILDREN
9.2/ 100
METRIC RATING
223rd/ 347
METRIC RANK
27.2%
FAMILY HOUSEHOLDS WITH CHILDREN
20.2/ 100
METRIC RATING
206th/ 347
METRIC RANK
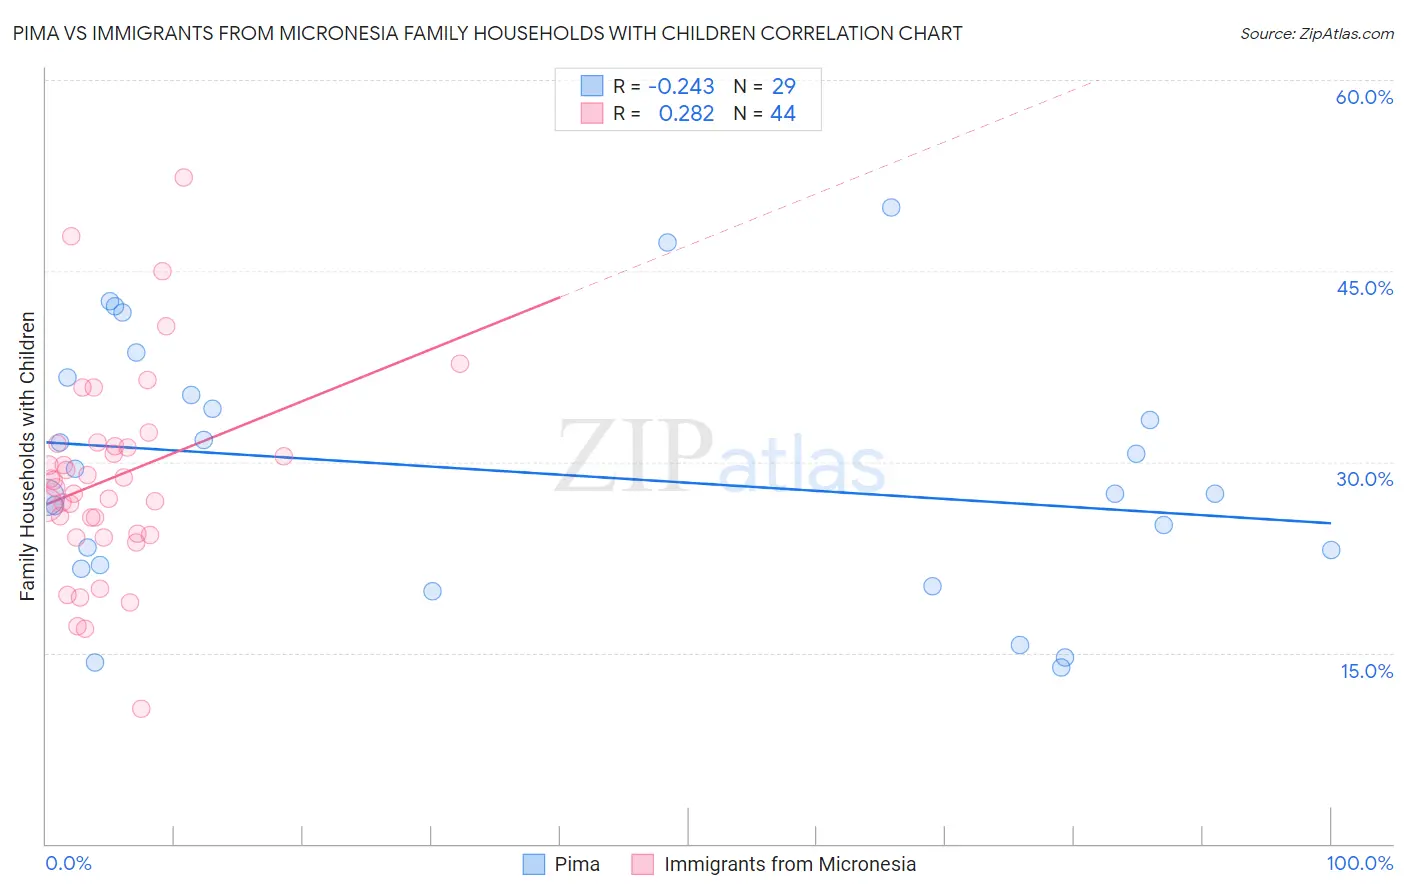
Pima vs Immigrants from Micronesia Family Households with Children Correlation Chart
The statistical analysis conducted on geographies consisting of 61,534,200 people shows a weak negative correlation between the proportion of Pima and percentage of family households with children in the United States with a correlation coefficient (R) of -0.243 and weighted average of 27.1%. Similarly, the statistical analysis conducted on geographies consisting of 61,601,070 people shows a weak positive correlation between the proportion of Immigrants from Micronesia and percentage of family households with children in the United States with a correlation coefficient (R) of 0.282 and weighted average of 27.2%, a difference of 0.51%.
Family Households with Children Correlation Summary
| Measurement | Pima | Immigrants from Micronesia |
| Minimum | 13.8% | 10.6% |
| Maximum | 50.0% | 52.3% |
| Range | 36.2% | 41.7% |
| Mean | 29.2% | 28.7% |
| Median | 27.5% | 28.3% |
| Interquartile 25% (IQ1) | 21.8% | 24.3% |
| Interquartile 75% (IQ3) | 35.9% | 31.4% |
| Interquartile Range (IQR) | 14.2% | 7.0% |
| Standard Deviation (Sample) | 9.9% | 7.9% |
| Standard Deviation (Population) | 9.7% | 7.9% |
Demographics Similar to Pima and Immigrants from Micronesia by Family Households with Children
In terms of family households with children, the demographic groups most similar to Pima are Paraguayan (27.1%, a difference of 0.010%), New Zealander (27.1%, a difference of 0.030%), German (27.1%, a difference of 0.030%), Austrian (27.1%, a difference of 0.050%), and Immigrants from Japan (27.1%, a difference of 0.090%). Similarly, the demographic groups most similar to Immigrants from Micronesia are Immigrants from Haiti (27.2%, a difference of 0.0%), Haitian (27.2%, a difference of 0.010%), Immigrants from Sudan (27.3%, a difference of 0.050%), Immigrants from Poland (27.2%, a difference of 0.14%), and Dutch West Indian (27.2%, a difference of 0.17%).
| Demographics | Rating | Rank | Family Households with Children |
| Immigrants | Sudan | 21.6 /100 | #204 | Fair 27.3% |
| Immigrants | Haiti | 20.3 /100 | #205 | Fair 27.2% |
| Immigrants | Micronesia | 20.2 /100 | #206 | Fair 27.2% |
| Haitians | 19.8 /100 | #207 | Poor 27.2% |
| Immigrants | Poland | 16.4 /100 | #208 | Poor 27.2% |
| Dutch West Indians | 15.8 /100 | #209 | Poor 27.2% |
| Immigrants | Ukraine | 14.4 /100 | #210 | Poor 27.2% |
| Welsh | 14.2 /100 | #211 | Poor 27.2% |
| Immigrants | Dominica | 13.9 /100 | #212 | Poor 27.2% |
| Okinawans | 13.7 /100 | #213 | Poor 27.2% |
| Africans | 13.0 /100 | #214 | Poor 27.2% |
| Northern Europeans | 12.8 /100 | #215 | Poor 27.2% |
| Cubans | 12.2 /100 | #216 | Poor 27.1% |
| U.S. Virgin Islanders | 12.1 /100 | #217 | Poor 27.1% |
| Greeks | 11.4 /100 | #218 | Poor 27.1% |
| Immigrants | Japan | 10.7 /100 | #219 | Poor 27.1% |
| Austrians | 9.9 /100 | #220 | Tragic 27.1% |
| New Zealanders | 9.6 /100 | #221 | Tragic 27.1% |
| Paraguayans | 9.4 /100 | #222 | Tragic 27.1% |
| Pima | 9.2 /100 | #223 | Tragic 27.1% |
| Germans | 8.7 /100 | #224 | Tragic 27.1% |