Crow vs Immigrants from Czechoslovakia Family Households with Children
COMPARE
Crow
Immigrants from Czechoslovakia
Family Households with Children
Family Households with Children Comparison
Crow
Immigrants from Czechoslovakia
27.4%
FAMILY HOUSEHOLDS WITH CHILDREN
35.7/ 100
METRIC RATING
195th/ 347
METRIC RANK
26.2%
FAMILY HOUSEHOLDS WITH CHILDREN
0.0/ 100
METRIC RATING
312th/ 347
METRIC RANK
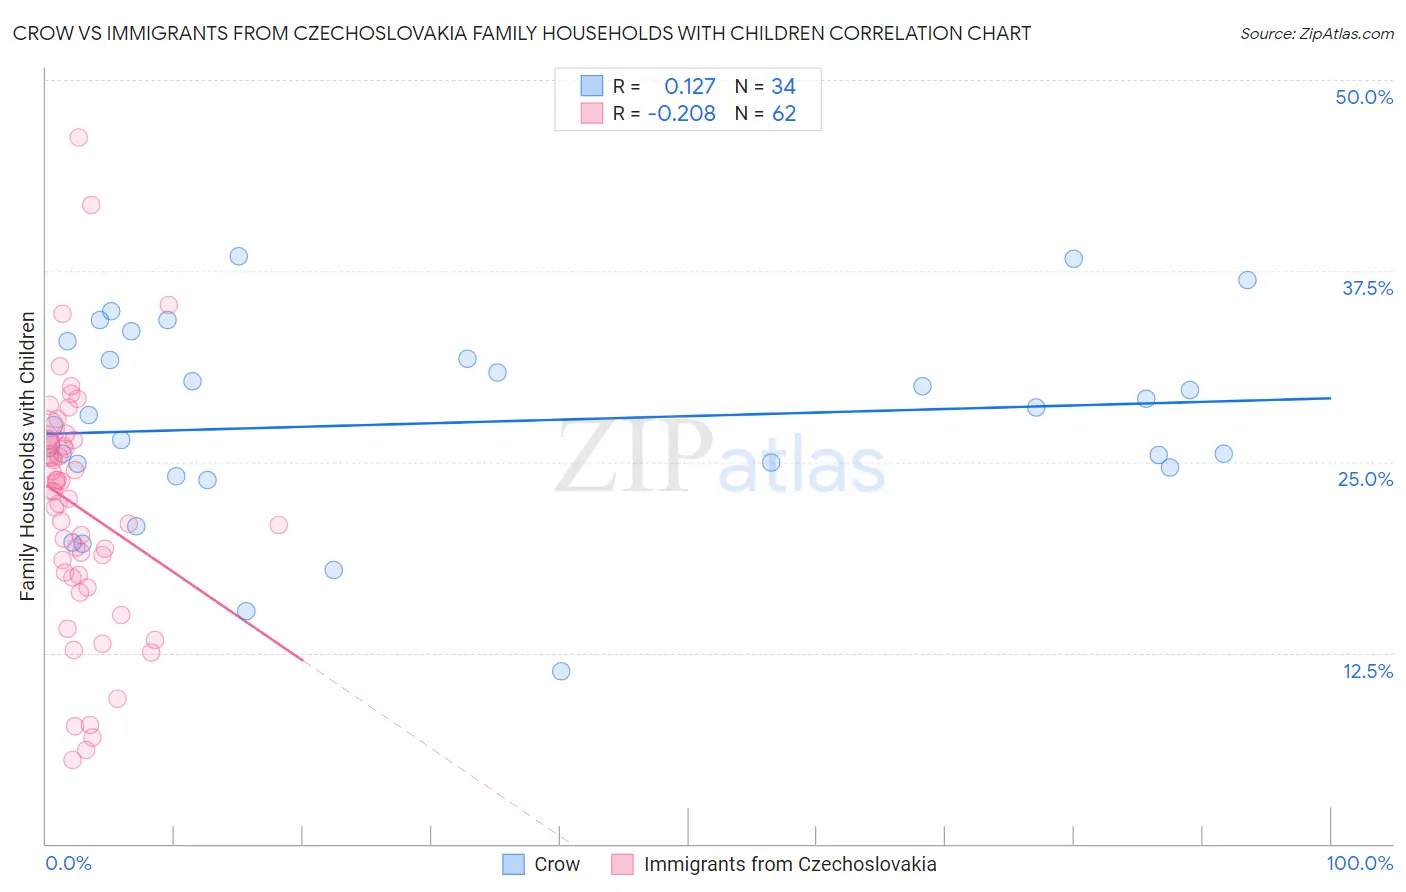
Crow vs Immigrants from Czechoslovakia Family Households with Children Correlation Chart
The statistical analysis conducted on geographies consisting of 59,201,015 people shows a poor positive correlation between the proportion of Crow and percentage of family households with children in the United States with a correlation coefficient (R) of 0.127 and weighted average of 27.4%. Similarly, the statistical analysis conducted on geographies consisting of 195,398,985 people shows a weak negative correlation between the proportion of Immigrants from Czechoslovakia and percentage of family households with children in the United States with a correlation coefficient (R) of -0.208 and weighted average of 26.2%, a difference of 4.3%.
Family Households with Children Correlation Summary
| Measurement | Crow | Immigrants from Czechoslovakia |
| Minimum | 11.3% | 5.5% |
| Maximum | 38.5% | 46.3% |
| Range | 27.2% | 40.8% |
| Mean | 27.6% | 22.0% |
| Median | 27.7% | 23.1% |
| Interquartile 25% (IQ1) | 24.7% | 17.6% |
| Interquartile 75% (IQ3) | 31.7% | 26.4% |
| Interquartile Range (IQR) | 7.1% | 8.8% |
| Standard Deviation (Sample) | 6.4% | 8.0% |
| Standard Deviation (Population) | 6.3% | 7.9% |
Similar Demographics by Family Households with Children
Demographics Similar to Crow by Family Households with Children
In terms of family households with children, the demographic groups most similar to Crow are Immigrants from Iran (27.4%, a difference of 0.010%), Cheyenne (27.4%, a difference of 0.020%), Norwegian (27.4%, a difference of 0.020%), Swedish (27.4%, a difference of 0.030%), and Immigrants from Romania (27.4%, a difference of 0.030%).
| Demographics | Rating | Rank | Family Households with Children |
| Dutch | 38.8 /100 | #188 | Fair 27.4% |
| Immigrants | Israel | 37.9 /100 | #189 | Fair 27.4% |
| Immigrants | Uruguay | 37.7 /100 | #190 | Fair 27.4% |
| Sudanese | 37.6 /100 | #191 | Fair 27.4% |
| Pennsylvania Germans | 37.5 /100 | #192 | Fair 27.4% |
| Swedes | 36.9 /100 | #193 | Fair 27.4% |
| Immigrants | Iran | 36.1 /100 | #194 | Fair 27.4% |
| Crow | 35.7 /100 | #195 | Fair 27.4% |
| Cheyenne | 35.1 /100 | #196 | Fair 27.4% |
| Norwegians | 35.0 /100 | #197 | Fair 27.4% |
| Immigrants | Romania | 34.4 /100 | #198 | Fair 27.4% |
| English | 32.0 /100 | #199 | Fair 27.3% |
| Immigrants | Congo | 28.7 /100 | #200 | Fair 27.3% |
| Bhutanese | 25.1 /100 | #201 | Fair 27.3% |
| Americans | 22.8 /100 | #202 | Fair 27.3% |
Demographics Similar to Immigrants from Czechoslovakia by Family Households with Children
In terms of family households with children, the demographic groups most similar to Immigrants from Czechoslovakia are Colville (26.2%, a difference of 0.070%), Marshallese (26.2%, a difference of 0.12%), Immigrants from Somalia (26.3%, a difference of 0.16%), Cree (26.2%, a difference of 0.26%), and Lumbee (26.3%, a difference of 0.27%).
| Demographics | Rating | Rank | Family Households with Children |
| Guyanese | 0.1 /100 | #305 | Tragic 26.3% |
| Bermudans | 0.1 /100 | #306 | Tragic 26.3% |
| West Indians | 0.0 /100 | #307 | Tragic 26.3% |
| Lumbee | 0.0 /100 | #308 | Tragic 26.3% |
| Immigrants | Somalia | 0.0 /100 | #309 | Tragic 26.3% |
| Marshallese | 0.0 /100 | #310 | Tragic 26.2% |
| Colville | 0.0 /100 | #311 | Tragic 26.2% |
| Immigrants | Czechoslovakia | 0.0 /100 | #312 | Tragic 26.2% |
| Cree | 0.0 /100 | #313 | Tragic 26.2% |
| French Canadians | 0.0 /100 | #314 | Tragic 26.1% |
| Immigrants | Norway | 0.0 /100 | #315 | Tragic 26.1% |
| Estonians | 0.0 /100 | #316 | Tragic 26.1% |
| Ottawa | 0.0 /100 | #317 | Tragic 26.1% |
| Iroquois | 0.0 /100 | #318 | Tragic 26.1% |
| Immigrants | France | 0.0 /100 | #319 | Tragic 26.0% |