Croatian vs Immigrants from Russia Births to Unmarried Women
COMPARE
Croatian
Immigrants from Russia
Births to Unmarried Women
Births to Unmarried Women Comparison
Croatians
Immigrants from Russia
30.2%
BIRTHS TO UNMARRIED WOMEN
88.0/ 100
METRIC RATING
124th/ 347
METRIC RANK
27.1%
BIRTHS TO UNMARRIED WOMEN
99.8/ 100
METRIC RATING
32nd/ 347
METRIC RANK
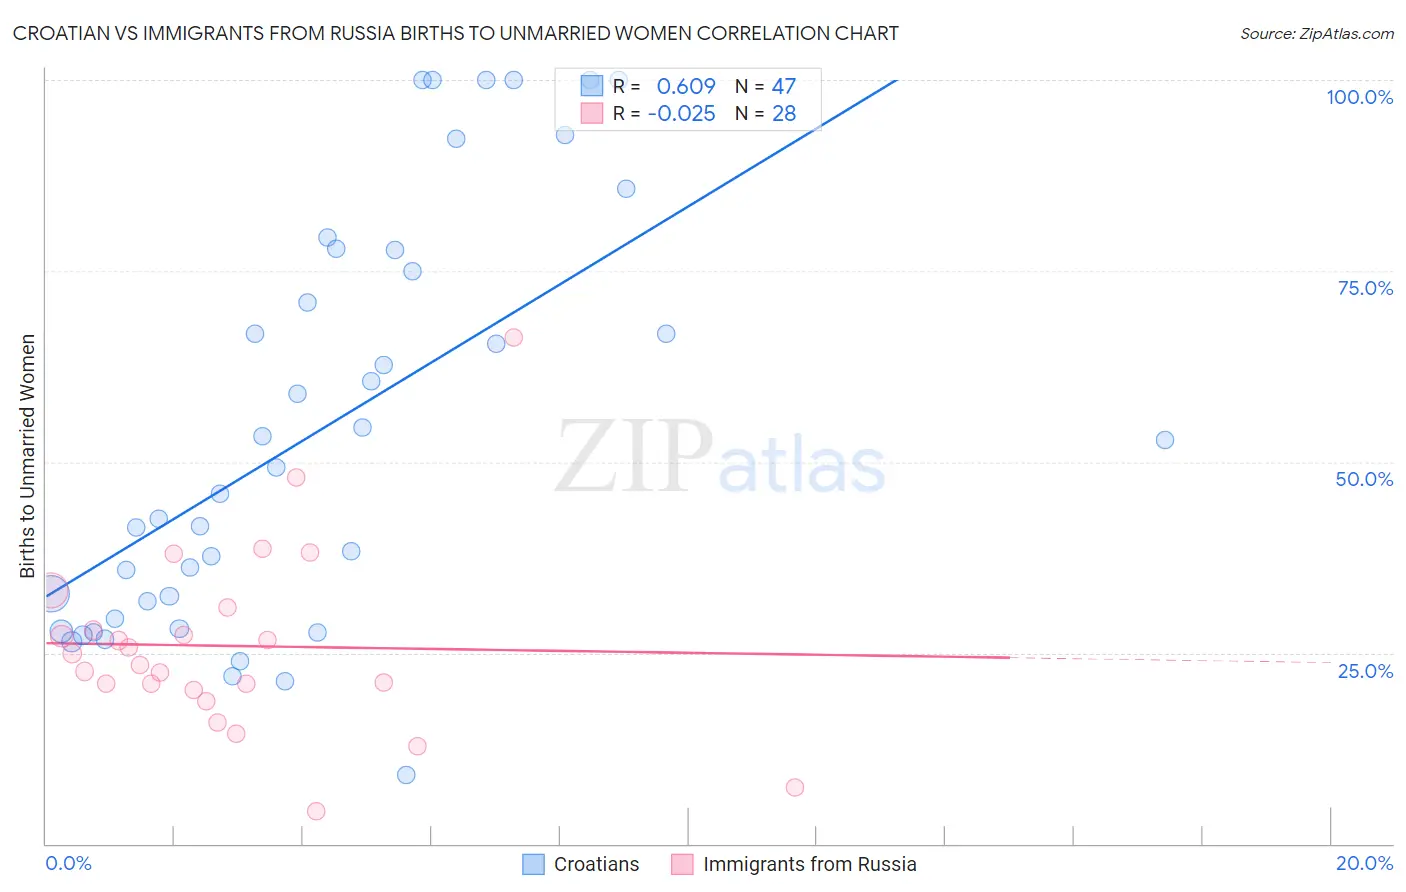
Croatian vs Immigrants from Russia Births to Unmarried Women Correlation Chart
The statistical analysis conducted on geographies consisting of 347,705,559 people shows a significant positive correlation between the proportion of Croatians and percentage of births to unmarried women in the United States with a correlation coefficient (R) of 0.609 and weighted average of 30.2%. Similarly, the statistical analysis conducted on geographies consisting of 324,310,093 people shows no correlation between the proportion of Immigrants from Russia and percentage of births to unmarried women in the United States with a correlation coefficient (R) of -0.025 and weighted average of 27.1%, a difference of 11.2%.
Births to Unmarried Women Correlation Summary
| Measurement | Croatian | Immigrants from Russia |
| Minimum | 9.0% | 4.3% |
| Maximum | 100.0% | 66.3% |
| Range | 91.0% | 62.0% |
| Mean | 54.4% | 25.9% |
| Median | 49.3% | 24.2% |
| Interquartile 25% (IQ1) | 29.4% | 20.5% |
| Interquartile 75% (IQ3) | 77.8% | 29.4% |
| Interquartile Range (IQR) | 48.4% | 8.9% |
| Standard Deviation (Sample) | 27.0% | 12.3% |
| Standard Deviation (Population) | 26.7% | 12.1% |
Similar Demographics by Births to Unmarried Women
Demographics Similar to Croatians by Births to Unmarried Women
In terms of births to unmarried women, the demographic groups most similar to Croatians are Syrian (30.2%, a difference of 0.040%), Vietnamese (30.2%, a difference of 0.070%), Immigrants from Argentina (30.1%, a difference of 0.17%), European (30.2%, a difference of 0.19%), and Korean (30.1%, a difference of 0.21%).
| Demographics | Rating | Rank | Births to Unmarried Women |
| Immigrants | Netherlands | 91.1 /100 | #117 | Exceptional 29.9% |
| Immigrants | Norway | 91.0 /100 | #118 | Exceptional 29.9% |
| Argentineans | 90.5 /100 | #119 | Exceptional 30.0% |
| Ugandans | 89.2 /100 | #120 | Excellent 30.1% |
| Koreans | 88.9 /100 | #121 | Excellent 30.1% |
| Immigrants | Argentina | 88.7 /100 | #122 | Excellent 30.1% |
| Syrians | 88.2 /100 | #123 | Excellent 30.2% |
| Croatians | 88.0 /100 | #124 | Excellent 30.2% |
| Vietnamese | 87.7 /100 | #125 | Excellent 30.2% |
| Europeans | 87.2 /100 | #126 | Excellent 30.2% |
| Chinese | 87.1 /100 | #127 | Excellent 30.2% |
| Icelanders | 86.0 /100 | #128 | Excellent 30.3% |
| Immigrants | Spain | 85.8 /100 | #129 | Excellent 30.3% |
| Immigrants | Bosnia and Herzegovina | 85.7 /100 | #130 | Excellent 30.3% |
| Immigrants | Zimbabwe | 85.7 /100 | #131 | Excellent 30.3% |
Demographics Similar to Immigrants from Russia by Births to Unmarried Women
In terms of births to unmarried women, the demographic groups most similar to Immigrants from Russia are Immigrants from Iraq (27.1%, a difference of 0.030%), Immigrants from Sri Lanka (27.2%, a difference of 0.070%), Immigrants from Pakistan (27.2%, a difference of 0.11%), Immigrants from Ireland (27.2%, a difference of 0.19%), and Immigrants from Western Asia (27.2%, a difference of 0.26%).
| Demographics | Rating | Rank | Births to Unmarried Women |
| Cambodians | 99.9 /100 | #25 | Exceptional 26.7% |
| Asians | 99.9 /100 | #26 | Exceptional 26.8% |
| Immigrants | Asia | 99.9 /100 | #27 | Exceptional 26.8% |
| Okinawans | 99.8 /100 | #28 | Exceptional 26.9% |
| Cypriots | 99.8 /100 | #29 | Exceptional 27.0% |
| Bulgarians | 99.8 /100 | #30 | Exceptional 27.1% |
| Immigrants | Iraq | 99.8 /100 | #31 | Exceptional 27.1% |
| Immigrants | Russia | 99.8 /100 | #32 | Exceptional 27.1% |
| Immigrants | Sri Lanka | 99.8 /100 | #33 | Exceptional 27.2% |
| Immigrants | Pakistan | 99.8 /100 | #34 | Exceptional 27.2% |
| Immigrants | Ireland | 99.7 /100 | #35 | Exceptional 27.2% |
| Immigrants | Western Asia | 99.7 /100 | #36 | Exceptional 27.2% |
| Immigrants | Ukraine | 99.7 /100 | #37 | Exceptional 27.2% |
| Immigrants | Moldova | 99.7 /100 | #38 | Exceptional 27.3% |
| Immigrants | Malaysia | 99.7 /100 | #39 | Exceptional 27.4% |