Creek vs Inupiat Single Father Households
COMPARE
Creek
Inupiat
Single Father Households
Single Father Households Comparison
Creek
Inupiat
2.6%
SINGLE FATHER HOUSEHOLDS
0.2/ 100
METRIC RATING
271st/ 347
METRIC RANK
4.9%
SINGLE FATHER HOUSEHOLDS
0.0/ 100
METRIC RATING
346th/ 347
METRIC RANK
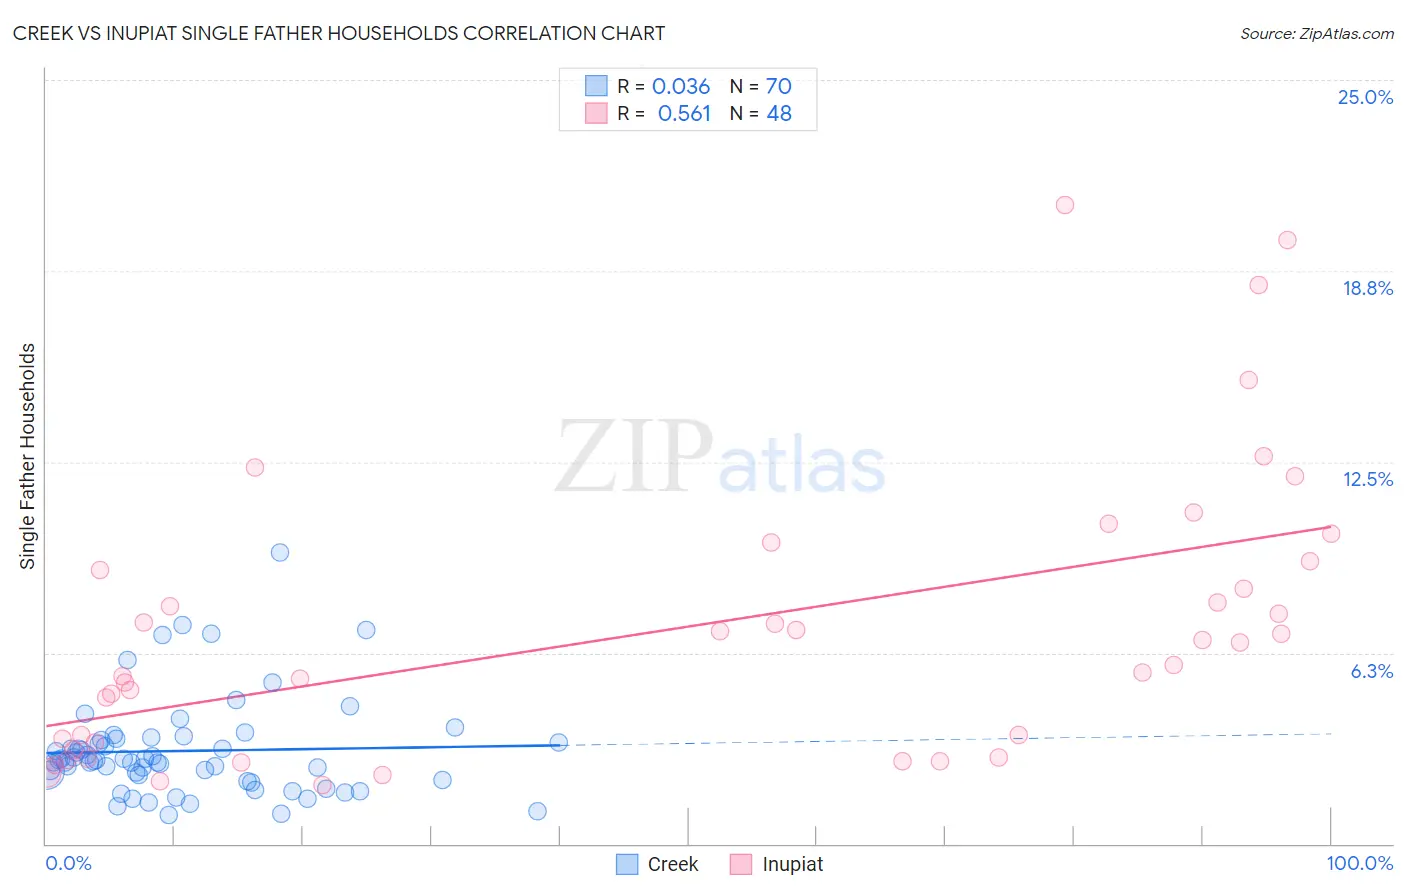
Creek vs Inupiat Single Father Households Correlation Chart
The statistical analysis conducted on geographies consisting of 177,693,364 people shows no correlation between the proportion of Creek and percentage of single father households in the United States with a correlation coefficient (R) of 0.036 and weighted average of 2.6%. Similarly, the statistical analysis conducted on geographies consisting of 96,117,395 people shows a substantial positive correlation between the proportion of Inupiat and percentage of single father households in the United States with a correlation coefficient (R) of 0.561 and weighted average of 4.9%, a difference of 86.8%.
Single Father Households Correlation Summary
| Measurement | Creek | Inupiat |
| Minimum | 0.96% | 1.9% |
| Maximum | 9.5% | 20.9% |
| Range | 8.6% | 19.0% |
| Mean | 3.0% | 7.0% |
| Median | 2.7% | 6.2% |
| Interquartile 25% (IQ1) | 2.1% | 3.2% |
| Interquartile 75% (IQ3) | 3.4% | 9.1% |
| Interquartile Range (IQR) | 1.3% | 5.9% |
| Standard Deviation (Sample) | 1.6% | 4.6% |
| Standard Deviation (Population) | 1.6% | 4.6% |
Similar Demographics by Single Father Households
Demographics Similar to Creek by Single Father Households
In terms of single father households, the demographic groups most similar to Creek are Belizean (2.6%, a difference of 0.0%), Iroquois (2.6%, a difference of 0.050%), Puerto Rican (2.6%, a difference of 0.070%), Seminole (2.6%, a difference of 0.36%), and Cuban (2.6%, a difference of 0.50%).
| Demographics | Rating | Rank | Single Father Households |
| Indonesians | 0.5 /100 | #264 | Tragic 2.6% |
| Immigrants | Micronesia | 0.5 /100 | #265 | Tragic 2.6% |
| French American Indians | 0.5 /100 | #266 | Tragic 2.6% |
| Guamanians/Chamorros | 0.4 /100 | #267 | Tragic 2.6% |
| Haitians | 0.4 /100 | #268 | Tragic 2.6% |
| Cubans | 0.3 /100 | #269 | Tragic 2.6% |
| Seminole | 0.3 /100 | #270 | Tragic 2.6% |
| Creek | 0.2 /100 | #271 | Tragic 2.6% |
| Belizeans | 0.2 /100 | #272 | Tragic 2.6% |
| Iroquois | 0.2 /100 | #273 | Tragic 2.6% |
| Puerto Ricans | 0.2 /100 | #274 | Tragic 2.6% |
| Immigrants | Dominican Republic | 0.2 /100 | #275 | Tragic 2.6% |
| Immigrants | Haiti | 0.1 /100 | #276 | Tragic 2.6% |
| Shoshone | 0.1 /100 | #277 | Tragic 2.6% |
| Cherokee | 0.1 /100 | #278 | Tragic 2.6% |
Demographics Similar to Inupiat by Single Father Households
In terms of single father households, the demographic groups most similar to Inupiat are Yup'ik (5.4%, a difference of 10.7%), Menominee (4.2%, a difference of 15.3%), Yakama (4.2%, a difference of 16.2%), Pima (4.2%, a difference of 16.4%), and Tohono O'odham (3.8%, a difference of 27.2%).
| Demographics | Rating | Rank | Single Father Households |
| Natives/Alaskans | 0.0 /100 | #333 | Tragic 3.2% |
| Yuman | 0.0 /100 | #334 | Tragic 3.3% |
| Colville | 0.0 /100 | #335 | Tragic 3.3% |
| Paiute | 0.0 /100 | #336 | Tragic 3.3% |
| Pueblo | 0.0 /100 | #337 | Tragic 3.3% |
| Sioux | 0.0 /100 | #338 | Tragic 3.3% |
| Alaskan Athabascans | 0.0 /100 | #339 | Tragic 3.4% |
| Alaska Natives | 0.0 /100 | #340 | Tragic 3.5% |
| Crow | 0.0 /100 | #341 | Tragic 3.5% |
| Tohono O'odham | 0.0 /100 | #342 | Tragic 3.8% |
| Pima | 0.0 /100 | #343 | Tragic 4.2% |
| Yakama | 0.0 /100 | #344 | Tragic 4.2% |
| Menominee | 0.0 /100 | #345 | Tragic 4.2% |
| Inupiat | 0.0 /100 | #346 | Tragic 4.9% |
| Yup'ik | 0.0 /100 | #347 | Tragic 5.4% |