Palestinian vs Inupiat Single Father Households
COMPARE
Palestinian
Inupiat
Single Father Households
Single Father Households Comparison
Palestinians
Inupiat
2.2%
SINGLE FATHER HOUSEHOLDS
98.6/ 100
METRIC RATING
105th/ 347
METRIC RANK
4.9%
SINGLE FATHER HOUSEHOLDS
0.0/ 100
METRIC RATING
346th/ 347
METRIC RANK
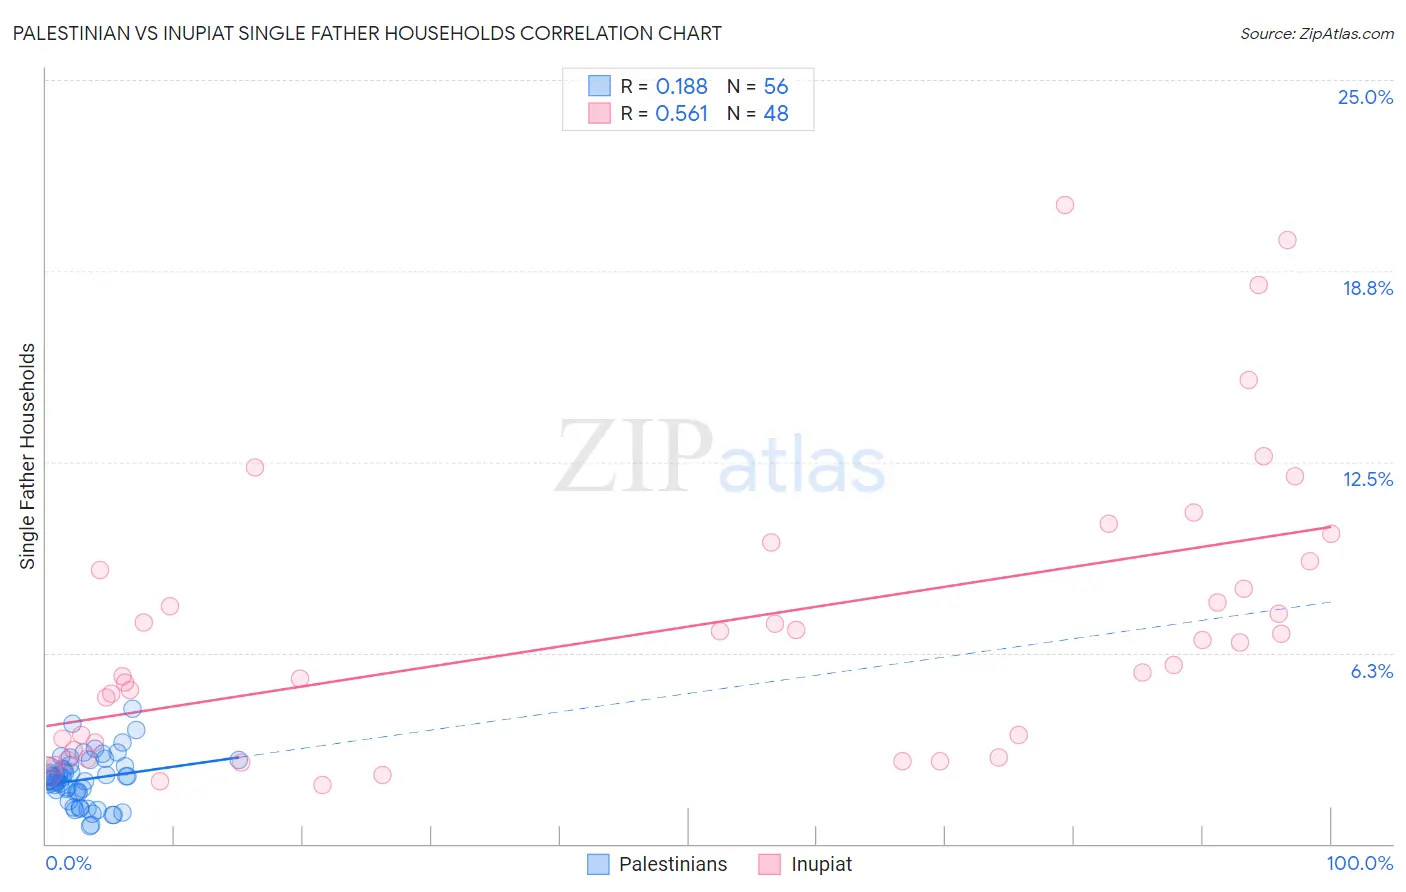
Palestinian vs Inupiat Single Father Households Correlation Chart
The statistical analysis conducted on geographies consisting of 215,869,880 people shows a poor positive correlation between the proportion of Palestinians and percentage of single father households in the United States with a correlation coefficient (R) of 0.188 and weighted average of 2.2%. Similarly, the statistical analysis conducted on geographies consisting of 96,117,395 people shows a substantial positive correlation between the proportion of Inupiat and percentage of single father households in the United States with a correlation coefficient (R) of 0.561 and weighted average of 4.9%, a difference of 125.7%.
Single Father Households Correlation Summary
| Measurement | Palestinian | Inupiat |
| Minimum | 0.57% | 1.9% |
| Maximum | 4.4% | 20.9% |
| Range | 3.8% | 19.0% |
| Mean | 2.1% | 7.0% |
| Median | 2.2% | 6.2% |
| Interquartile 25% (IQ1) | 1.7% | 3.2% |
| Interquartile 75% (IQ3) | 2.6% | 9.1% |
| Interquartile Range (IQR) | 0.88% | 5.9% |
| Standard Deviation (Sample) | 0.81% | 4.6% |
| Standard Deviation (Population) | 0.80% | 4.6% |
Similar Demographics by Single Father Households
Demographics Similar to Palestinians by Single Father Households
In terms of single father households, the demographic groups most similar to Palestinians are Immigrants from Southern Europe (2.2%, a difference of 0.11%), Slovene (2.2%, a difference of 0.23%), Immigrants from Netherlands (2.2%, a difference of 0.25%), Barbadian (2.2%, a difference of 0.29%), and Alsatian (2.1%, a difference of 0.37%).
| Demographics | Rating | Rank | Single Father Households |
| Guyanese | 99.1 /100 | #98 | Exceptional 2.1% |
| South Africans | 99.1 /100 | #99 | Exceptional 2.1% |
| Immigrants | Northern Africa | 99.0 /100 | #100 | Exceptional 2.1% |
| Immigrants | Western Europe | 98.9 /100 | #101 | Exceptional 2.1% |
| Argentineans | 98.9 /100 | #102 | Exceptional 2.1% |
| Lebanese | 98.9 /100 | #103 | Exceptional 2.1% |
| Alsatians | 98.9 /100 | #104 | Exceptional 2.1% |
| Palestinians | 98.6 /100 | #105 | Exceptional 2.2% |
| Immigrants | Southern Europe | 98.6 /100 | #106 | Exceptional 2.2% |
| Slovenes | 98.5 /100 | #107 | Exceptional 2.2% |
| Immigrants | Netherlands | 98.5 /100 | #108 | Exceptional 2.2% |
| Barbadians | 98.4 /100 | #109 | Exceptional 2.2% |
| Italians | 98.3 /100 | #110 | Exceptional 2.2% |
| Immigrants | Canada | 98.3 /100 | #111 | Exceptional 2.2% |
| Immigrants | Trinidad and Tobago | 98.2 /100 | #112 | Exceptional 2.2% |
Demographics Similar to Inupiat by Single Father Households
In terms of single father households, the demographic groups most similar to Inupiat are Yup'ik (5.4%, a difference of 10.7%), Menominee (4.2%, a difference of 15.3%), Yakama (4.2%, a difference of 16.2%), Pima (4.2%, a difference of 16.4%), and Tohono O'odham (3.8%, a difference of 27.2%).
| Demographics | Rating | Rank | Single Father Households |
| Natives/Alaskans | 0.0 /100 | #333 | Tragic 3.2% |
| Yuman | 0.0 /100 | #334 | Tragic 3.3% |
| Colville | 0.0 /100 | #335 | Tragic 3.3% |
| Paiute | 0.0 /100 | #336 | Tragic 3.3% |
| Pueblo | 0.0 /100 | #337 | Tragic 3.3% |
| Sioux | 0.0 /100 | #338 | Tragic 3.3% |
| Alaskan Athabascans | 0.0 /100 | #339 | Tragic 3.4% |
| Alaska Natives | 0.0 /100 | #340 | Tragic 3.5% |
| Crow | 0.0 /100 | #341 | Tragic 3.5% |
| Tohono O'odham | 0.0 /100 | #342 | Tragic 3.8% |
| Pima | 0.0 /100 | #343 | Tragic 4.2% |
| Yakama | 0.0 /100 | #344 | Tragic 4.2% |
| Menominee | 0.0 /100 | #345 | Tragic 4.2% |
| Inupiat | 0.0 /100 | #346 | Tragic 4.9% |
| Yup'ik | 0.0 /100 | #347 | Tragic 5.4% |