Hungarian vs Inupiat Single Father Households
COMPARE
Hungarian
Inupiat
Single Father Households
Single Father Households Comparison
Hungarians
Inupiat
2.2%
SINGLE FATHER HOUSEHOLDS
97.9/ 100
METRIC RATING
117th/ 347
METRIC RANK
4.9%
SINGLE FATHER HOUSEHOLDS
0.0/ 100
METRIC RATING
346th/ 347
METRIC RANK
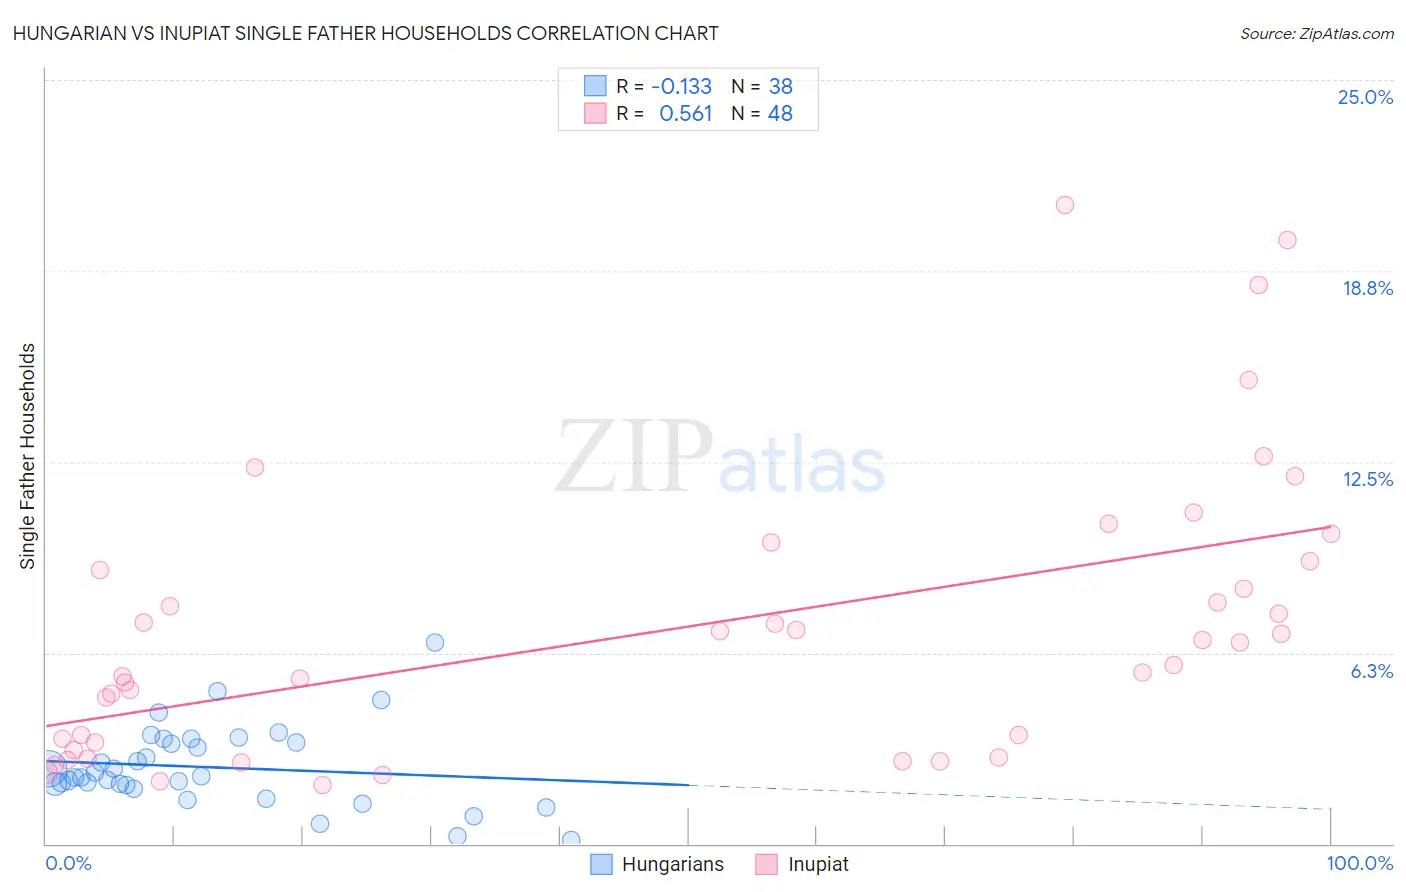
Hungarian vs Inupiat Single Father Households Correlation Chart
The statistical analysis conducted on geographies consisting of 478,655,062 people shows a poor negative correlation between the proportion of Hungarians and percentage of single father households in the United States with a correlation coefficient (R) of -0.133 and weighted average of 2.2%. Similarly, the statistical analysis conducted on geographies consisting of 96,117,395 people shows a substantial positive correlation between the proportion of Inupiat and percentage of single father households in the United States with a correlation coefficient (R) of 0.561 and weighted average of 4.9%, a difference of 123.9%.
Single Father Households Correlation Summary
| Measurement | Hungarian | Inupiat |
| Minimum | 0.13% | 1.9% |
| Maximum | 6.6% | 20.9% |
| Range | 6.5% | 19.0% |
| Mean | 2.5% | 7.0% |
| Median | 2.2% | 6.2% |
| Interquartile 25% (IQ1) | 1.9% | 3.2% |
| Interquartile 75% (IQ3) | 3.3% | 9.1% |
| Interquartile Range (IQR) | 1.4% | 5.9% |
| Standard Deviation (Sample) | 1.3% | 4.6% |
| Standard Deviation (Population) | 1.3% | 4.6% |
Similar Demographics by Single Father Households
Demographics Similar to Hungarians by Single Father Households
In terms of single father households, the demographic groups most similar to Hungarians are Immigrants from Morocco (2.2%, a difference of 0.10%), Trinidadian and Tobagonian (2.2%, a difference of 0.16%), Immigrants from Argentina (2.2%, a difference of 0.19%), Australian (2.2%, a difference of 0.19%), and Immigrants from Brazil (2.2%, a difference of 0.19%).
| Demographics | Rating | Rank | Single Father Households |
| Italians | 98.3 /100 | #110 | Exceptional 2.2% |
| Immigrants | Canada | 98.3 /100 | #111 | Exceptional 2.2% |
| Immigrants | Trinidad and Tobago | 98.2 /100 | #112 | Exceptional 2.2% |
| Iraqis | 98.2 /100 | #113 | Exceptional 2.2% |
| Immigrants | North America | 98.2 /100 | #114 | Exceptional 2.2% |
| Immigrants | Barbados | 98.2 /100 | #115 | Exceptional 2.2% |
| Immigrants | Argentina | 98.1 /100 | #116 | Exceptional 2.2% |
| Hungarians | 97.9 /100 | #117 | Exceptional 2.2% |
| Immigrants | Morocco | 97.8 /100 | #118 | Exceptional 2.2% |
| Trinidadians and Tobagonians | 97.8 /100 | #119 | Exceptional 2.2% |
| Australians | 97.7 /100 | #120 | Exceptional 2.2% |
| Immigrants | Brazil | 97.7 /100 | #121 | Exceptional 2.2% |
| Immigrants | Iraq | 97.6 /100 | #122 | Exceptional 2.2% |
| Immigrants | Yemen | 97.5 /100 | #123 | Exceptional 2.2% |
| British West Indians | 97.4 /100 | #124 | Exceptional 2.2% |
Demographics Similar to Inupiat by Single Father Households
In terms of single father households, the demographic groups most similar to Inupiat are Yup'ik (5.4%, a difference of 10.7%), Menominee (4.2%, a difference of 15.3%), Yakama (4.2%, a difference of 16.2%), Pima (4.2%, a difference of 16.4%), and Tohono O'odham (3.8%, a difference of 27.2%).
| Demographics | Rating | Rank | Single Father Households |
| Natives/Alaskans | 0.0 /100 | #333 | Tragic 3.2% |
| Yuman | 0.0 /100 | #334 | Tragic 3.3% |
| Colville | 0.0 /100 | #335 | Tragic 3.3% |
| Paiute | 0.0 /100 | #336 | Tragic 3.3% |
| Pueblo | 0.0 /100 | #337 | Tragic 3.3% |
| Sioux | 0.0 /100 | #338 | Tragic 3.3% |
| Alaskan Athabascans | 0.0 /100 | #339 | Tragic 3.4% |
| Alaska Natives | 0.0 /100 | #340 | Tragic 3.5% |
| Crow | 0.0 /100 | #341 | Tragic 3.5% |
| Tohono O'odham | 0.0 /100 | #342 | Tragic 3.8% |
| Pima | 0.0 /100 | #343 | Tragic 4.2% |
| Yakama | 0.0 /100 | #344 | Tragic 4.2% |
| Menominee | 0.0 /100 | #345 | Tragic 4.2% |
| Inupiat | 0.0 /100 | #346 | Tragic 4.9% |
| Yup'ik | 0.0 /100 | #347 | Tragic 5.4% |