Colville vs Turkish Single Mother Households

COMPARE

Colville
Race
Ancestry
AfghanAfricanAlaska NativeAlaskan AthabascanAlbanianAleutAlsatianAmericanApacheArabArapahoArgentineanArmenianAssyrian/Chaldean/SyriacAustralianAustrianBahamianBangladeshiBarbadianBasqueBelgianBelizeanBermudanBhutaneseBlackfeetBolivianBrazilianBritishBritish West IndianBulgarianBurmeseCajunCambodianCanadianCape VerdeanCarpatho RusynCelticCentral AmericanCentral American IndianCherokeeCheyenneChickasawChileanChineseChippewaChoctawColombianColvilleComancheCosta RicanCreeCreekCroatianCrowCubanCypriotCzechCzechoslovakianDanishDelawareDominicanDutchDutch West IndianEastern EuropeanEcuadorianEgyptianEnglishEstonianEthiopianEuropeanFijianFilipinoFinnishFrenchFrench American IndianFrench CanadianGermanGerman RussianGhanaianGreekGuamanian/ChamorroGuatemalanGuyaneseHaitianHmongHonduranHopiHoumaHungarianIcelanderIndian (Asian)IndonesianInupiatIranianIraqiIrishIroquoisIsraeliItalianJamaicanJapaneseJordanianKenyanKiowaKoreanLaotianLatvianLebaneseLiberianLithuanianLumbeeLuxembourgerMacedonianMalaysianMalteseMarshalleseMenomineeMexicanMexican American IndianMongolianMoroccanNative HawaiianNavajoNepaleseNew ZealanderNicaraguanNigerianNorthern EuropeanNorwegianOkinawanOsageOttawaPaiutePakistaniPalestinianPanamanianParaguayanPennsylvania GermanPeruvianPimaPolishPortuguesePotawatomiPuebloPuerto RicanPuget Sound SalishRomanianRussianSalvadoranSamoanScandinavianScotch-IrishScottishSeminoleSenegaleseSerbianShoshoneSierra LeoneanSiouxSlavicSlovakSloveneSomaliSouth AfricanSouth AmericanSouth American IndianSoviet UnionSpaniardSpanishSpanish AmericanSpanish American IndianSri LankanSubsaharan AfricanSudaneseSwedishSwissSyrianTaiwaneseThaiTlingit-HaidaTohono O'OdhamTonganTrinidadian and TobagonianTsimshianU.S. Virgin IslanderUgandanUkrainianUruguayanUteVenezuelanVietnameseWelshWest IndianYakamaYaquiYugoslavianYumanYup'ikZimbabwean
Immigration
NonimmigrantsImmigrantsAfghanistanAfricaAlbaniaArgentinaArmeniaAsiaAustraliaAustriaBahamasBangladeshBarbadosBelarusBelgiumBelizeBoliviaBosnia and HerzegovinaBrazilBulgariaBurma/MyanmarCabo VerdeCambodiaCameroonCanadaCaribbeanCentral AmericaChileChinaColombiaCongoCosta RicaCroatiaCubaCzechoslovakiaDenmarkDominicaDominican RepublicEastern AfricaEastern AsiaEastern EuropeEcuadorEgyptEl SalvadorEnglandEritreaEthiopiaEuropeFijiFranceGermanyGhanaGreeceGrenadaGuatemalaGuyanaHaitiHondurasHong KongHungaryIndiaIndonesiaIranIraqIrelandIsraelItalyJamaicaJapanJordanKazakhstanKenyaKoreaKuwaitLaosLatin AmericaLatviaLebanonLiberiaLithuaniaMalaysiaMexicoMicronesiaMiddle AfricaMoldovaMoroccoNepalNetherlandsNicaraguaNigeriaNorth AmericaNorth MacedoniaNorthern AfricaNorthern EuropeNorwayOceaniaPakistanPanamaPeruPhilippinesPolandPortugalRomaniaRussiaSaudi ArabiaScotlandSenegalSerbiaSierra LeoneSingaporeSomaliaSouth AfricaSouth AmericaSouth Central AsiaSouth Eastern AsiaSouthern EuropeSpainSri LankaSt. Vincent and the GrenadinesSudanSwedenSwitzerlandSyriaTaiwanThailandTrinidad and TobagoTurkeyUgandaUkraineUruguayUzbekistanVenezuelaVietnamWest IndiesWestern AfricaWestern AsiaWestern EuropeYemenZaireZimbabweAzores
Turkish
Race
Ancestry
AfghanAfricanAlaska NativeAlaskan AthabascanAlbanianAleutAlsatianAmericanApacheArabArapahoArgentineanArmenianAssyrian/Chaldean/SyriacAustralianAustrianBahamianBangladeshiBarbadianBasqueBelgianBelizeanBermudanBhutaneseBlackfeetBolivianBrazilianBritishBritish West IndianBulgarianBurmeseCajunCambodianCanadianCape VerdeanCarpatho RusynCelticCentral AmericanCentral American IndianCherokeeCheyenneChickasawChileanChineseChippewaChoctawColombianComancheCosta RicanCreeCreekCroatianCrowCubanCypriotCzechCzechoslovakianDanishDelawareDominicanDutchDutch West IndianEastern EuropeanEcuadorianEgyptianEnglishEstonianEthiopianEuropeanFijianFilipinoFinnishFrenchFrench American IndianFrench CanadianGermanGerman RussianGhanaianGreekGuamanian/ChamorroGuatemalanGuyaneseHaitianHmongHonduranHopiHoumaHungarianIcelanderIndian (Asian)IndonesianInupiatIranianIraqiIrishIroquoisIsraeliItalianJamaicanJapaneseJordanianKenyanKiowaKoreanLaotianLatvianLebaneseLiberianLithuanianLumbeeLuxembourgerMacedonianMalaysianMalteseMarshalleseMenomineeMexicanMexican American IndianMongolianMoroccanNative HawaiianNavajoNepaleseNew ZealanderNicaraguanNigerianNorthern EuropeanNorwegianOkinawanOsageOttawaPaiutePakistaniPalestinianPanamanianParaguayanPennsylvania GermanPeruvianPimaPolishPortuguesePotawatomiPuebloPuerto RicanPuget Sound SalishRomanianRussianSalvadoranSamoanScandinavianScotch-IrishScottishSeminoleSenegaleseSerbianShoshoneSierra LeoneanSiouxSlavicSlovakSloveneSomaliSouth AfricanSouth AmericanSouth American IndianSoviet UnionSpaniardSpanishSpanish AmericanSpanish American IndianSri LankanSubsaharan AfricanSudaneseSwedishSwissSyrianTaiwaneseThaiTlingit-HaidaTohono O'OdhamTonganTrinidadian and TobagonianTsimshianTurkishU.S. Virgin IslanderUgandanUkrainianUruguayanUteVenezuelanVietnameseWelshWest IndianYakamaYaquiYugoslavianYumanYup'ikZimbabwean
Immigration
NonimmigrantsImmigrantsAfghanistanAfricaAlbaniaArgentinaArmeniaAsiaAustraliaAustriaBahamasBangladeshBarbadosBelarusBelgiumBelizeBoliviaBosnia and HerzegovinaBrazilBulgariaBurma/MyanmarCabo VerdeCambodiaCameroonCanadaCaribbeanCentral AmericaChileChinaColombiaCongoCosta RicaCroatiaCubaCzechoslovakiaDenmarkDominicaDominican RepublicEastern AfricaEastern AsiaEastern EuropeEcuadorEgyptEl SalvadorEnglandEritreaEthiopiaEuropeFijiFranceGermanyGhanaGreeceGrenadaGuatemalaGuyanaHaitiHondurasHong KongHungaryIndiaIndonesiaIranIraqIrelandIsraelItalyJamaicaJapanJordanKazakhstanKenyaKoreaKuwaitLaosLatin AmericaLatviaLebanonLiberiaLithuaniaMalaysiaMexicoMicronesiaMiddle AfricaMoldovaMoroccoNepalNetherlandsNicaraguaNigeriaNorth AmericaNorth MacedoniaNorthern AfricaNorthern EuropeNorwayOceaniaPakistanPanamaPeruPhilippinesPolandPortugalRomaniaRussiaSaudi ArabiaScotlandSenegalSerbiaSierra LeoneSingaporeSomaliaSouth AfricaSouth AmericaSouth Central AsiaSouth Eastern AsiaSouthern EuropeSpainSri LankaSt. Vincent and the GrenadinesSudanSwedenSwitzerlandSyriaTaiwanThailandTrinidad and TobagoTurkeyUgandaUkraineUruguayUzbekistanVenezuelaVietnamWest IndiesWestern AfricaWestern AsiaWestern EuropeYemenZaireZimbabweAzores
Single Mother Households
Income
Poverty
Unemployment
Labor Participation
Family Structure
Vehicle Availability
Education Level
Disability

Single Mother Households Comparison

Colville

Turks

Tragic
Exceptional
8.0%
SINGLE MOTHER HOUSEHOLDS
0.0/ 100
METRIC RATING
305th/ 347
METRIC RANK
5.5%
SINGLE MOTHER HOUSEHOLDS
99.2/ 100
METRIC RATING
48th/ 347
METRIC RANK

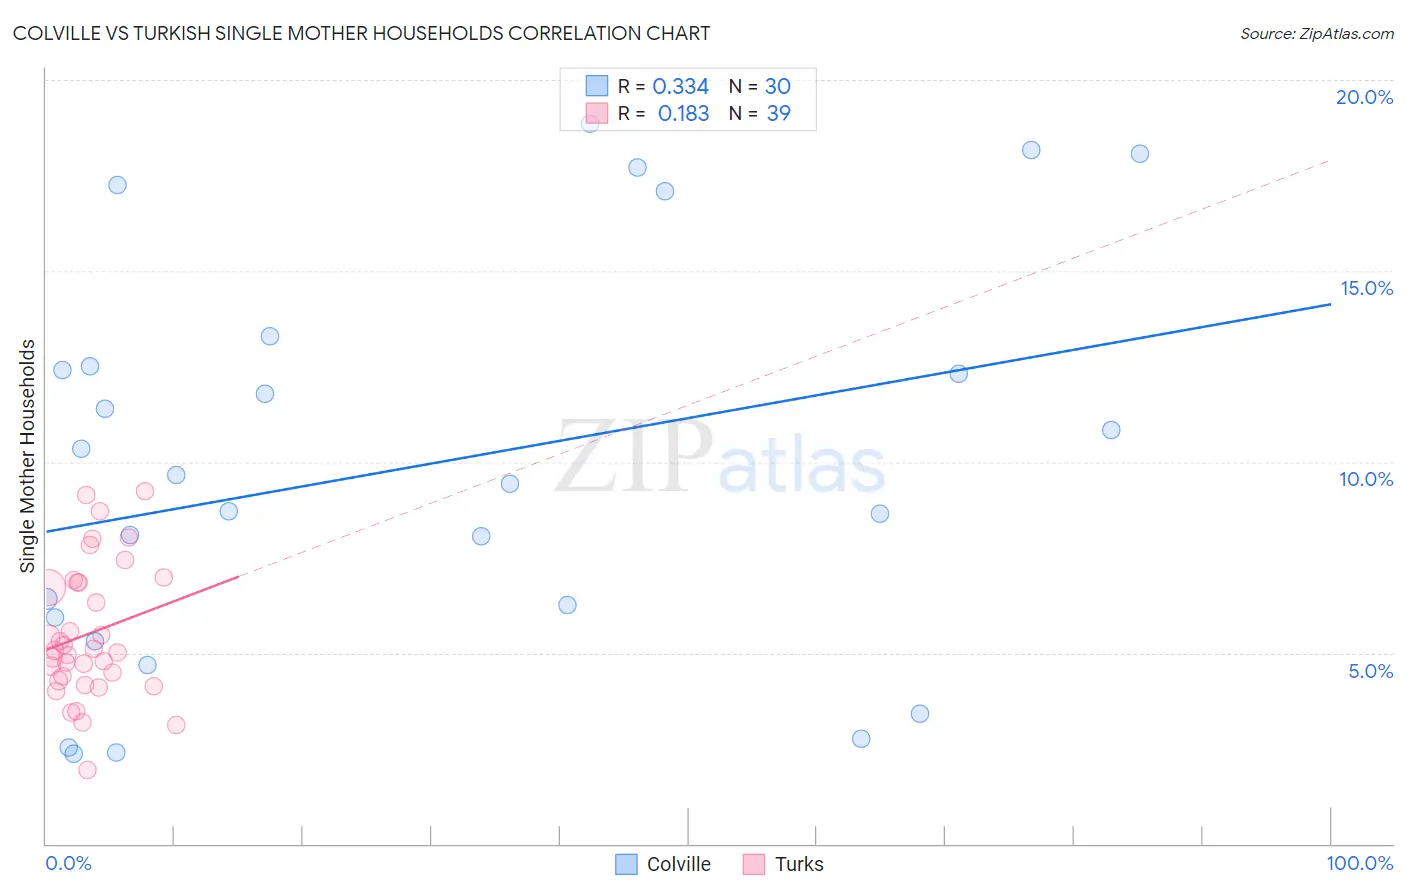
Colville vs Turkish Single Mother Households Correlation Chart

The statistical analysis conducted on geographies consisting of 34,673,137 people shows a mild positive correlation between the proportion of Colville and percentage of single mother households in the United States with a correlation coefficient (R) of 0.334 and weighted average of 8.0%. Similarly, the statistical analysis conducted on geographies consisting of 271,337,640 people shows a poor positive correlation between the proportion of Turks and percentage of single mother households in the United States with a correlation coefficient (R) of 0.183 and weighted average of 5.5%, a difference of 46.6%.
Colville vs Turkish Single Mother Households

Single Mother Households Correlation Summary

MeasurementColvilleTurkish
Minimum2.4%1.9%
Maximum18.9%9.2%
Range16.5%7.3%
Mean9.9%5.5%
Median9.5%5.1%
Interquartile 25% (IQ1)5.9%4.3%
Interquartile 75% (IQ3)12.5%6.9%
Interquartile Range (IQR)6.6%2.6%
Standard Deviation (Sample)5.2%1.8%
Standard Deviation (Population)5.1%1.7%

Similar Demographics by Single Mother Households

Demographics Similar to Colville by Single Mother Households

In terms of single mother households, the demographic groups most similar to Colville are Native/Alaskan (8.0%, a difference of 0.050%), Immigrants from Barbados (8.0%, a difference of 0.070%), Immigrants from St. Vincent and the Grenadines (8.0%, a difference of 0.32%), Immigrants from Central America (8.1%, a difference of 0.33%), and Immigrants from Bahamas (8.0%, a difference of 0.49%).
DemographicsRating | RankSingle Mother Households
Immigrants | West Indies
0.0
/100
|
#298
Tragic
7.9%
Houma
0.0
/100
|
#299
Tragic
7.9%
Mexicans
0.0
/100
|
#300
Tragic
8.0%
Chippewa
0.0
/100
|
#301
Tragic
8.0%
Immigrants | Ghana
0.0
/100
|
#302
Tragic
8.0%
Immigrants | Bahamas
0.0
/100
|
#303
Tragic
8.0%
Natives/Alaskans
0.0
/100
|
#304
Tragic
8.0%
Colville
0.0
/100
|
#305
Tragic
8.0%
Immigrants | Barbados
0.0
/100
|
#306
Tragic
8.0%
Immigrants | St. Vincent and the Grenadines
0.0
/100
|
#307
Tragic
8.0%
Immigrants | Central America
0.0
/100
|
#308
Tragic
8.1%
Cheyenne
0.0
/100
|
#309
Tragic
8.1%
Hondurans
0.0
/100
|
#310
Tragic
8.1%
Immigrants | Congo
0.0
/100
|
#311
Tragic
8.1%
Bangladeshis
0.0
/100
|
#312
Tragic
8.1%

Demographics Similar to Turks by Single Mother Households

In terms of single mother households, the demographic groups most similar to Turks are Immigrants from Latvia (5.5%, a difference of 0.030%), Norwegian (5.5%, a difference of 0.20%), Immigrants from Scotland (5.5%, a difference of 0.22%), Immigrants from Belarus (5.5%, a difference of 0.24%), and Swedish (5.5%, a difference of 0.30%).
DemographicsRating | RankSingle Mother Households
Immigrants | Greece
99.5
/100
|
#41
Exceptional
5.4%
Macedonians
99.5
/100
|
#42
Exceptional
5.4%
Immigrants | South Central Asia
99.5
/100
|
#43
Exceptional
5.4%
Lithuanians
99.4
/100
|
#44
Exceptional
5.4%
Immigrants | Croatia
99.4
/100
|
#45
Exceptional
5.4%
Croatians
99.3
/100
|
#46
Exceptional
5.5%
Norwegians
99.3
/100
|
#47
Exceptional
5.5%
Turks
99.2
/100
|
#48
Exceptional
5.5%
Immigrants | Latvia
99.2
/100
|
#49
Exceptional
5.5%
Immigrants | Scotland
99.2
/100
|
#50
Exceptional
5.5%
Immigrants | Belarus
99.2
/100
|
#51
Exceptional
5.5%
Swedes
99.1
/100
|
#52
Exceptional
5.5%
Immigrants | Russia
99.1
/100
|
#53
Exceptional
5.5%
Immigrants | Lebanon
99.1
/100
|
#54
Exceptional
5.5%
Immigrants | Denmark
99.1
/100
|
#55
Exceptional
5.5%