Central American vs Marshallese Unemployment Among Ages 60 to 64 years
COMPARE
Central American
Marshallese
Unemployment Among Ages 60 to 64 years
Unemployment Among Ages 60 to 64 years Comparison
Central Americans
Marshallese
5.2%
UNEMPLOYMENT AMONG AGES 60 TO 64 YEARS
0.0/ 100
METRIC RATING
276th/ 347
METRIC RANK
3.7%
UNEMPLOYMENT AMONG AGES 60 TO 64 YEARS
100.0/ 100
METRIC RATING
1st/ 347
METRIC RANK
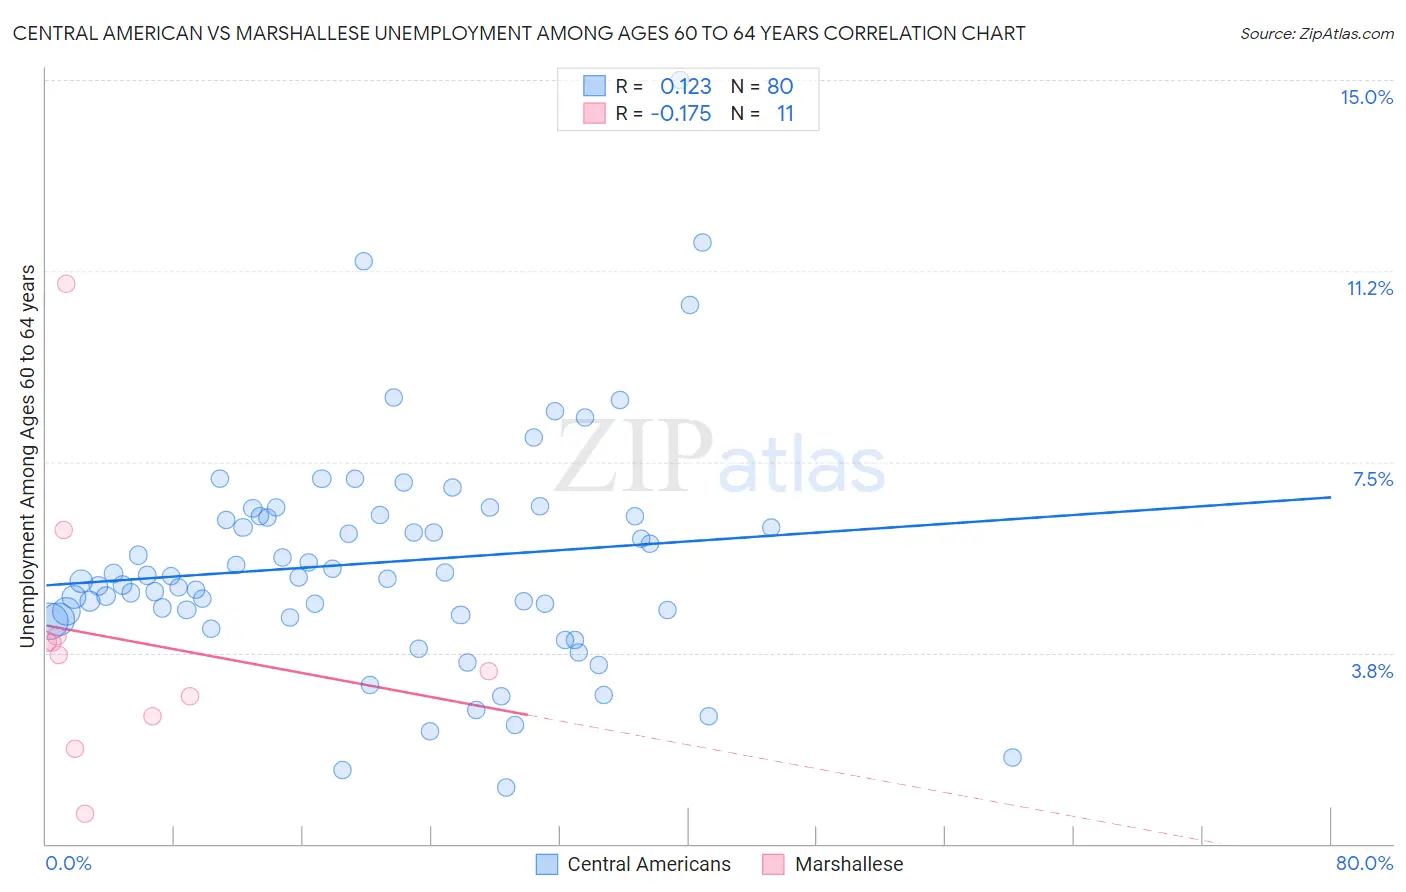
Central American vs Marshallese Unemployment Among Ages 60 to 64 years Correlation Chart
The statistical analysis conducted on geographies consisting of 436,480,787 people shows a poor positive correlation between the proportion of Central Americans and unemployment rate among population between the ages 60 and 64 in the United States with a correlation coefficient (R) of 0.123 and weighted average of 5.2%. Similarly, the statistical analysis conducted on geographies consisting of 14,034,493 people shows a poor negative correlation between the proportion of Marshallese and unemployment rate among population between the ages 60 and 64 in the United States with a correlation coefficient (R) of -0.175 and weighted average of 3.7%, a difference of 38.5%.
Unemployment Among Ages 60 to 64 years Correlation Summary
| Measurement | Central American | Marshallese |
| Minimum | 1.1% | 0.60% |
| Maximum | 15.0% | 11.0% |
| Range | 13.9% | 10.4% |
| Mean | 5.5% | 4.0% |
| Median | 5.2% | 3.7% |
| Interquartile 25% (IQ1) | 4.5% | 2.5% |
| Interquartile 75% (IQ3) | 6.4% | 4.1% |
| Interquartile Range (IQR) | 2.0% | 1.6% |
| Standard Deviation (Sample) | 2.3% | 2.7% |
| Standard Deviation (Population) | 2.2% | 2.6% |
Similar Demographics by Unemployment Among Ages 60 to 64 years
Demographics Similar to Central Americans by Unemployment Among Ages 60 to 64 years
In terms of unemployment among ages 60 to 64 years, the demographic groups most similar to Central Americans are Immigrants from Hong Kong (5.2%, a difference of 0.16%), Immigrants from Caribbean (5.2%, a difference of 0.27%), Hopi (5.2%, a difference of 0.30%), Immigrants from Spain (5.2%, a difference of 0.44%), and Haitian (5.2%, a difference of 0.51%).
| Demographics | Rating | Rank | Unemployment Among Ages 60 to 64 years |
| Immigrants | Costa Rica | 0.2 /100 | #269 | Tragic 5.1% |
| Immigrants | Iran | 0.1 /100 | #270 | Tragic 5.1% |
| Israelis | 0.1 /100 | #271 | Tragic 5.2% |
| Haitians | 0.1 /100 | #272 | Tragic 5.2% |
| Immigrants | Spain | 0.1 /100 | #273 | Tragic 5.2% |
| Hopi | 0.1 /100 | #274 | Tragic 5.2% |
| Immigrants | Hong Kong | 0.1 /100 | #275 | Tragic 5.2% |
| Central Americans | 0.0 /100 | #276 | Tragic 5.2% |
| Immigrants | Caribbean | 0.0 /100 | #277 | Tragic 5.2% |
| Guatemalans | 0.0 /100 | #278 | Tragic 5.2% |
| Nepalese | 0.0 /100 | #279 | Tragic 5.2% |
| French American Indians | 0.0 /100 | #280 | Tragic 5.2% |
| Immigrants | Haiti | 0.0 /100 | #281 | Tragic 5.2% |
| Mexicans | 0.0 /100 | #282 | Tragic 5.2% |
| Immigrants | Guatemala | 0.0 /100 | #283 | Tragic 5.3% |
Demographics Similar to Marshallese by Unemployment Among Ages 60 to 64 years
In terms of unemployment among ages 60 to 64 years, the demographic groups most similar to Marshallese are Fijian (3.9%, a difference of 3.7%), Chinese (4.0%, a difference of 6.7%), Hmong (4.0%, a difference of 7.2%), Immigrants from the Azores (4.0%, a difference of 7.2%), and Immigrants from Congo (4.1%, a difference of 10.1%).
| Demographics | Rating | Rank | Unemployment Among Ages 60 to 64 years |
| Marshallese | 100.0 /100 | #1 | Exceptional 3.7% |
| Fijians | 100.0 /100 | #2 | Exceptional 3.9% |
| Chinese | 100.0 /100 | #3 | Exceptional 4.0% |
| Hmong | 100.0 /100 | #4 | Exceptional 4.0% |
| Immigrants | Azores | 100.0 /100 | #5 | Exceptional 4.0% |
| Immigrants | Congo | 100.0 /100 | #6 | Exceptional 4.1% |
| Lumbee | 100.0 /100 | #7 | Exceptional 4.2% |
| Immigrants | Micronesia | 100.0 /100 | #8 | Exceptional 4.2% |
| Indonesians | 100.0 /100 | #9 | Exceptional 4.2% |
| Immigrants | Bosnia and Herzegovina | 100.0 /100 | #10 | Exceptional 4.2% |
| Luxembourgers | 100.0 /100 | #11 | Exceptional 4.3% |
| Immigrants | Cuba | 100.0 /100 | #12 | Exceptional 4.3% |
| Chickasaw | 100.0 /100 | #13 | Exceptional 4.3% |
| Norwegians | 100.0 /100 | #14 | Exceptional 4.3% |
| Sudanese | 100.0 /100 | #15 | Exceptional 4.3% |