Central American vs Ukrainian Average Family Size
COMPARE
Central American
Ukrainian
Average Family Size
Average Family Size Comparison
Central Americans
Ukrainians
3.41
AVERAGE FAMILY SIZE
100.0/ 100
METRIC RATING
31st/ 347
METRIC RANK
3.14
AVERAGE FAMILY SIZE
0.2/ 100
METRIC RATING
296th/ 347
METRIC RANK
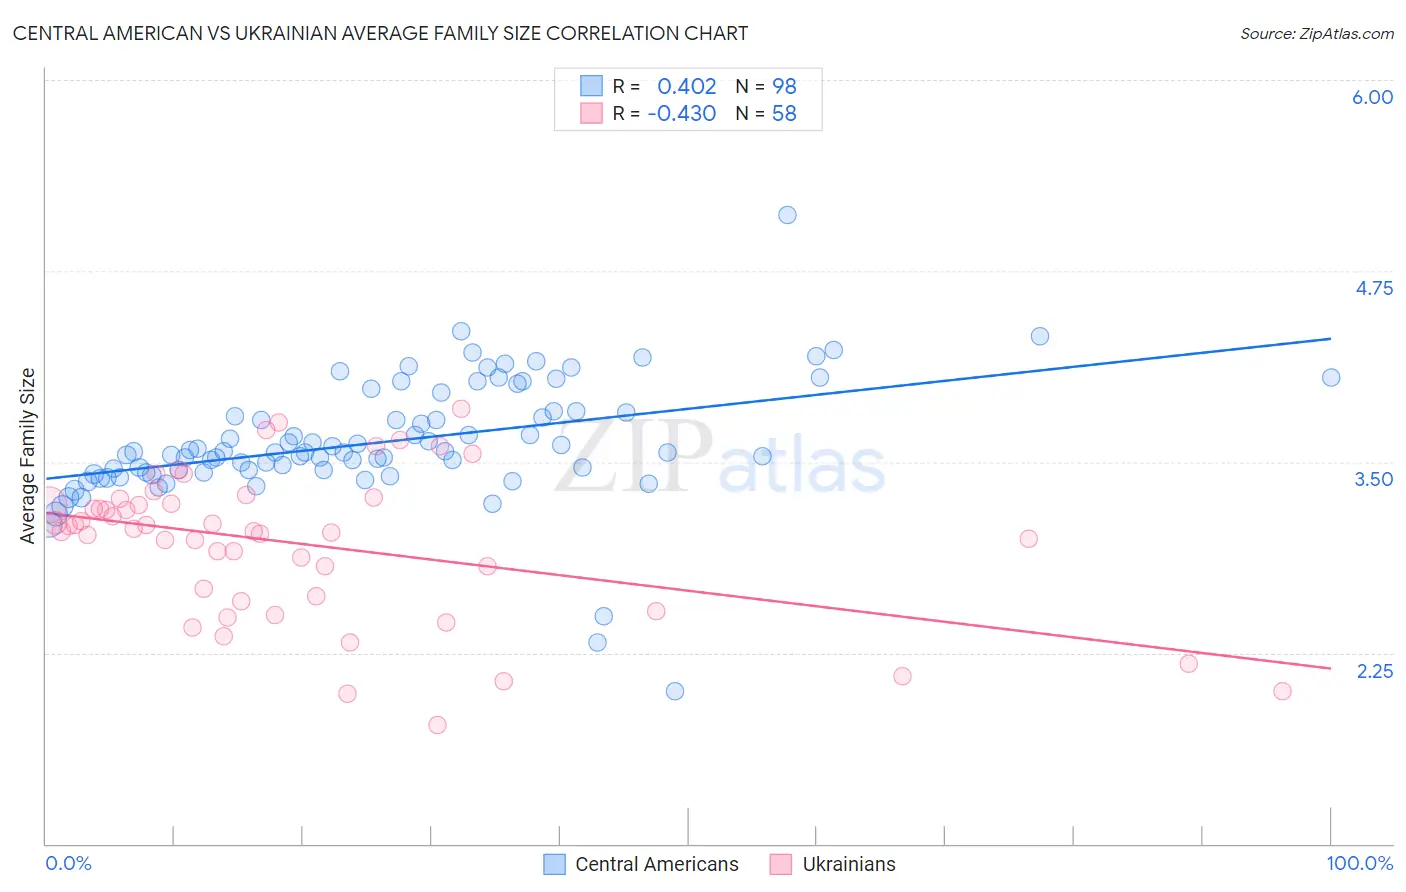
Central American vs Ukrainian Average Family Size Correlation Chart
The statistical analysis conducted on geographies consisting of 504,084,527 people shows a moderate positive correlation between the proportion of Central Americans and average family size in the United States with a correlation coefficient (R) of 0.402 and weighted average of 3.41. Similarly, the statistical analysis conducted on geographies consisting of 448,324,069 people shows a moderate negative correlation between the proportion of Ukrainians and average family size in the United States with a correlation coefficient (R) of -0.430 and weighted average of 3.14, a difference of 8.7%.
Average Family Size Correlation Summary
| Measurement | Central American | Ukrainian |
| Minimum | 2.00 | 1.78 |
| Maximum | 5.12 | 3.85 |
| Range | 3.12 | 2.07 |
| Mean | 3.63 | 2.96 |
| Median | 3.56 | 3.06 |
| Interquartile 25% (IQ1) | 3.43 | 2.62 |
| Interquartile 75% (IQ3) | 3.83 | 3.22 |
| Interquartile Range (IQR) | 0.40 | 0.60 |
| Standard Deviation (Sample) | 0.41 | 0.48 |
| Standard Deviation (Population) | 0.40 | 0.47 |
Similar Demographics by Average Family Size
Demographics Similar to Central Americans by Average Family Size
In terms of average family size, the demographic groups most similar to Central Americans are Immigrants from Guatemala (3.41, a difference of 0.10%), Hawaiian (3.41, a difference of 0.12%), Hispanic or Latino (3.41, a difference of 0.18%), Samoan (3.42, a difference of 0.20%), and Nepalese (3.42, a difference of 0.23%).
| Demographics | Rating | Rank | Average Family Size |
| Natives/Alaskans | 100.0 /100 | #24 | Exceptional 3.45 |
| Yakama | 100.0 /100 | #25 | Exceptional 3.45 |
| Native Hawaiians | 100.0 /100 | #26 | Exceptional 3.43 |
| Mexican American Indians | 100.0 /100 | #27 | Exceptional 3.43 |
| Immigrants | Latin America | 100.0 /100 | #28 | Exceptional 3.42 |
| Nepalese | 100.0 /100 | #29 | Exceptional 3.42 |
| Samoans | 100.0 /100 | #30 | Exceptional 3.42 |
| Central Americans | 100.0 /100 | #31 | Exceptional 3.41 |
| Immigrants | Guatemala | 100.0 /100 | #32 | Exceptional 3.41 |
| Hawaiians | 100.0 /100 | #33 | Exceptional 3.41 |
| Hispanics or Latinos | 100.0 /100 | #34 | Exceptional 3.41 |
| Guatemalans | 100.0 /100 | #35 | Exceptional 3.40 |
| Immigrants | Guyana | 100.0 /100 | #36 | Exceptional 3.40 |
| Guyanese | 100.0 /100 | #37 | Exceptional 3.40 |
| Immigrants | Belize | 100.0 /100 | #38 | Exceptional 3.39 |
Demographics Similar to Ukrainians by Average Family Size
In terms of average family size, the demographic groups most similar to Ukrainians are Austrian (3.14, a difference of 0.0%), Immigrants from Western Europe (3.14, a difference of 0.0%), Immigrants from Croatia (3.14, a difference of 0.010%), Colville (3.14, a difference of 0.010%), and European (3.14, a difference of 0.030%).
| Demographics | Rating | Rank | Average Family Size |
| Immigrants | Norway | 0.3 /100 | #289 | Tragic 3.14 |
| Cypriots | 0.3 /100 | #290 | Tragic 3.14 |
| Alsatians | 0.2 /100 | #291 | Tragic 3.14 |
| Europeans | 0.2 /100 | #292 | Tragic 3.14 |
| Scandinavians | 0.2 /100 | #293 | Tragic 3.14 |
| Immigrants | Croatia | 0.2 /100 | #294 | Tragic 3.14 |
| Austrians | 0.2 /100 | #295 | Tragic 3.14 |
| Ukrainians | 0.2 /100 | #296 | Tragic 3.14 |
| Immigrants | Western Europe | 0.2 /100 | #297 | Tragic 3.14 |
| Colville | 0.2 /100 | #298 | Tragic 3.14 |
| Canadians | 0.2 /100 | #299 | Tragic 3.14 |
| Immigrants | Sweden | 0.2 /100 | #300 | Tragic 3.14 |
| Macedonians | 0.2 /100 | #301 | Tragic 3.13 |
| Immigrants | Latvia | 0.2 /100 | #302 | Tragic 3.13 |
| British | 0.2 /100 | #303 | Tragic 3.13 |