Marshallese vs Slavic Births to Unmarried Women
COMPARE
Marshallese
Slavic
Births to Unmarried Women
Births to Unmarried Women Comparison
Marshallese
Slavs
34.8%
BIRTHS TO UNMARRIED WOMEN
1.6/ 100
METRIC RATING
237th/ 347
METRIC RANK
31.6%
BIRTHS TO UNMARRIED WOMEN
52.0/ 100
METRIC RATING
169th/ 347
METRIC RANK
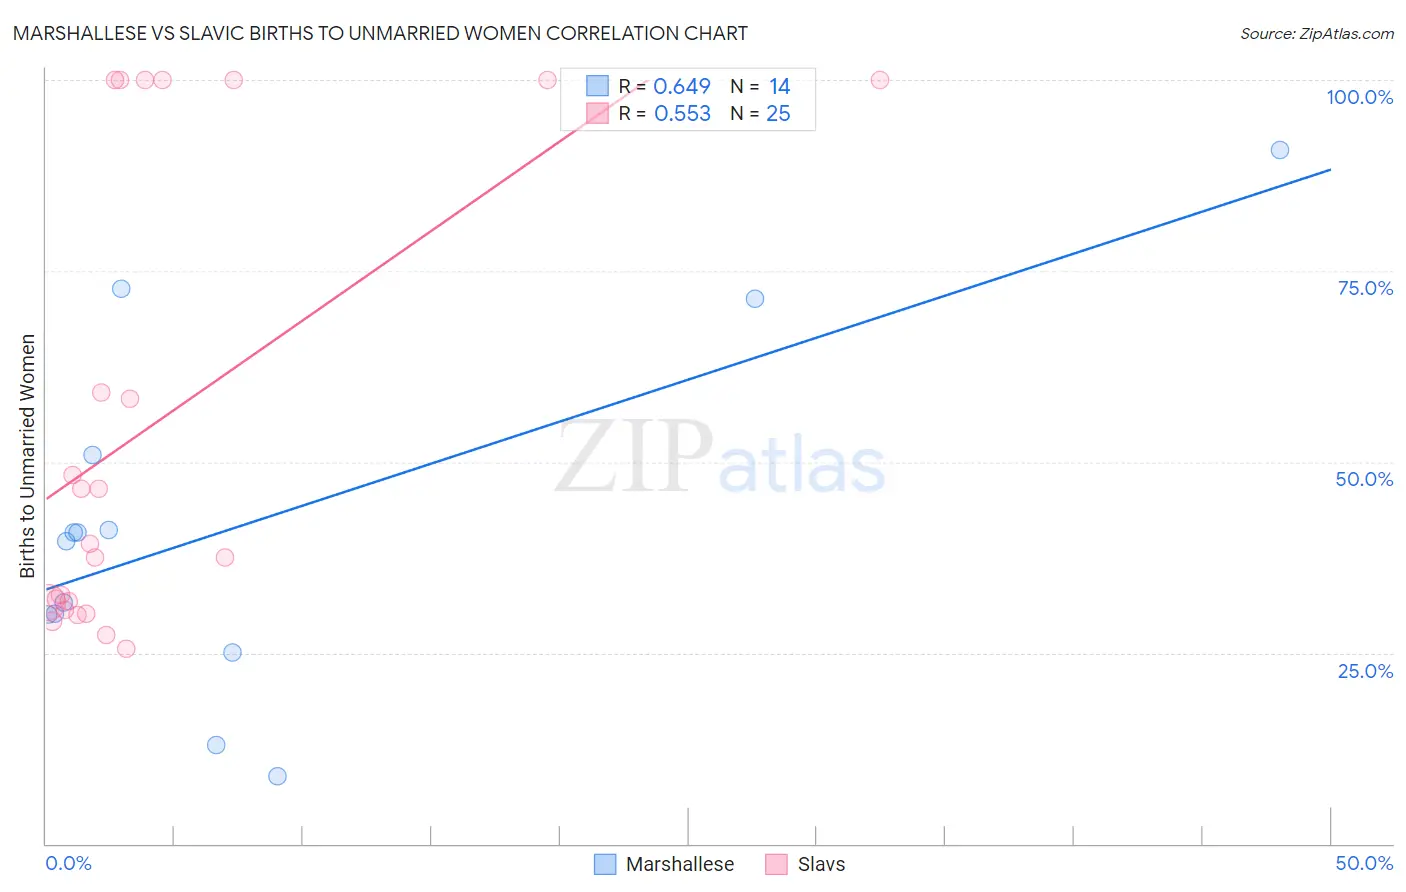
Marshallese vs Slavic Births to Unmarried Women Correlation Chart
The statistical analysis conducted on geographies consisting of 14,693,894 people shows a significant positive correlation between the proportion of Marshallese and percentage of births to unmarried women in the United States with a correlation coefficient (R) of 0.649 and weighted average of 34.8%. Similarly, the statistical analysis conducted on geographies consisting of 254,358,438 people shows a substantial positive correlation between the proportion of Slavs and percentage of births to unmarried women in the United States with a correlation coefficient (R) of 0.553 and weighted average of 31.6%, a difference of 10.0%.
Births to Unmarried Women Correlation Summary
| Measurement | Marshallese | Slavic |
| Minimum | 8.9% | 25.6% |
| Maximum | 90.9% | 100.0% |
| Range | 82.0% | 74.4% |
| Mean | 41.9% | 54.9% |
| Median | 40.2% | 39.3% |
| Interquartile 25% (IQ1) | 30.0% | 31.1% |
| Interquartile 75% (IQ3) | 51.0% | 100.0% |
| Interquartile Range (IQR) | 21.0% | 68.9% |
| Standard Deviation (Sample) | 23.0% | 29.9% |
| Standard Deviation (Population) | 22.2% | 29.3% |
Similar Demographics by Births to Unmarried Women
Demographics Similar to Marshallese by Births to Unmarried Women
In terms of births to unmarried women, the demographic groups most similar to Marshallese are Immigrants from Cambodia (34.8%, a difference of 0.060%), Immigrants from Cameroon (34.7%, a difference of 0.070%), Sierra Leonean (34.9%, a difference of 0.28%), Immigrants from Middle Africa (34.9%, a difference of 0.53%), and Immigrants from Guyana (35.0%, a difference of 0.57%).
| Demographics | Rating | Rank | Births to Unmarried Women |
| Ghanaians | 3.1 /100 | #230 | Tragic 34.3% |
| Native Hawaiians | 2.9 /100 | #231 | Tragic 34.3% |
| French Canadians | 2.5 /100 | #232 | Tragic 34.4% |
| Bangladeshis | 2.5 /100 | #233 | Tragic 34.4% |
| Immigrants | Zaire | 2.3 /100 | #234 | Tragic 34.5% |
| Immigrants | Ghana | 2.2 /100 | #235 | Tragic 34.5% |
| Immigrants | Cameroon | 1.6 /100 | #236 | Tragic 34.7% |
| Marshallese | 1.6 /100 | #237 | Tragic 34.8% |
| Immigrants | Cambodia | 1.6 /100 | #238 | Tragic 34.8% |
| Sierra Leoneans | 1.4 /100 | #239 | Tragic 34.9% |
| Immigrants | Middle Africa | 1.2 /100 | #240 | Tragic 34.9% |
| Immigrants | Guyana | 1.2 /100 | #241 | Tragic 35.0% |
| Indonesians | 1.2 /100 | #242 | Tragic 35.0% |
| Japanese | 0.9 /100 | #243 | Tragic 35.2% |
| Guyanese | 0.9 /100 | #244 | Tragic 35.2% |
Demographics Similar to Slavs by Births to Unmarried Women
In terms of births to unmarried women, the demographic groups most similar to Slavs are Belgian (31.6%, a difference of 0.030%), Guamanian/Chamorro (31.6%, a difference of 0.070%), Finnish (31.7%, a difference of 0.14%), Immigrants from Eritrea (31.7%, a difference of 0.15%), and Immigrants from Yemen (31.7%, a difference of 0.17%).
| Demographics | Rating | Rank | Births to Unmarried Women |
| Slovenes | 65.9 /100 | #162 | Good 31.2% |
| Immigrants | Chile | 65.7 /100 | #163 | Good 31.2% |
| Hungarians | 64.1 /100 | #164 | Good 31.2% |
| Immigrants | Somalia | 58.1 /100 | #165 | Average 31.4% |
| Peruvians | 55.5 /100 | #166 | Average 31.5% |
| Dutch | 55.3 /100 | #167 | Average 31.5% |
| Belgians | 52.4 /100 | #168 | Average 31.6% |
| Slavs | 52.0 /100 | #169 | Average 31.6% |
| Guamanians/Chamorros | 51.3 /100 | #170 | Average 31.6% |
| Finns | 50.5 /100 | #171 | Average 31.7% |
| Immigrants | Eritrea | 50.4 /100 | #172 | Average 31.7% |
| Immigrants | Yemen | 50.2 /100 | #173 | Average 31.7% |
| Venezuelans | 50.0 /100 | #174 | Average 31.7% |
| Immigrants | Venezuela | 49.2 /100 | #175 | Average 31.7% |
| Scottish | 48.1 /100 | #176 | Average 31.7% |