Canadian vs Immigrants from Ecuador Married-couple Households
COMPARE
Canadian
Immigrants from Ecuador
Married-couple Households
Married-couple Households Comparison
Canadians
Immigrants from Ecuador
48.2%
MARRIED-COUPLE HOUSEHOLDS
98.2/ 100
METRIC RATING
77th/ 347
METRIC RANK
42.9%
MARRIED-COUPLE HOUSEHOLDS
0.0/ 100
METRIC RATING
280th/ 347
METRIC RANK
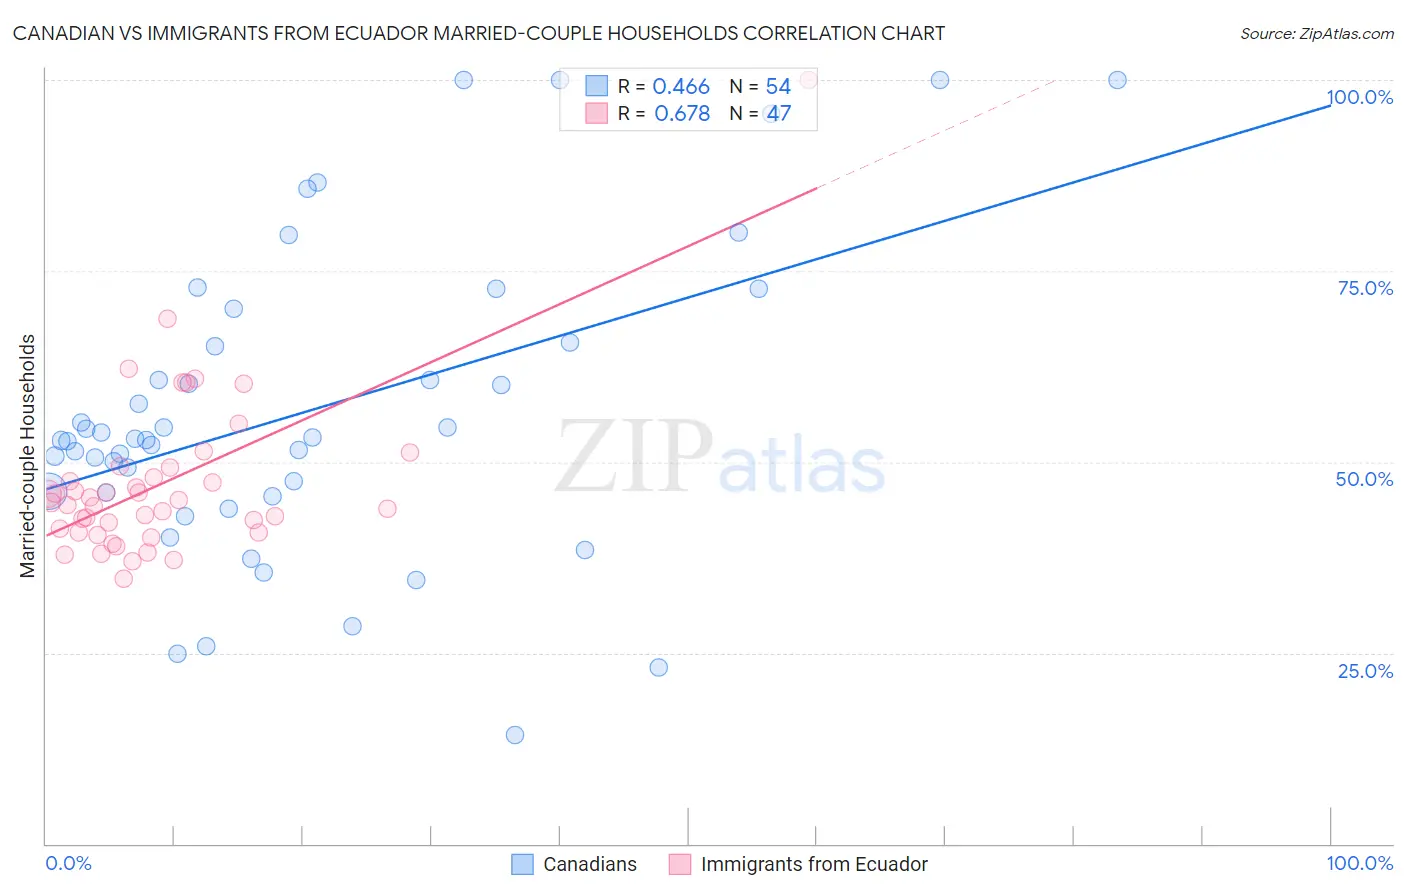
Canadian vs Immigrants from Ecuador Married-couple Households Correlation Chart
The statistical analysis conducted on geographies consisting of 437,266,431 people shows a moderate positive correlation between the proportion of Canadians and percentage of married-couple family households in the United States with a correlation coefficient (R) of 0.466 and weighted average of 48.2%. Similarly, the statistical analysis conducted on geographies consisting of 270,883,052 people shows a significant positive correlation between the proportion of Immigrants from Ecuador and percentage of married-couple family households in the United States with a correlation coefficient (R) of 0.678 and weighted average of 42.9%, a difference of 12.4%.
Married-couple Households Correlation Summary
| Measurement | Canadian | Immigrants from Ecuador |
| Minimum | 14.3% | 34.8% |
| Maximum | 100.0% | 100.0% |
| Range | 85.7% | 65.2% |
| Mean | 56.7% | 47.2% |
| Median | 52.9% | 44.7% |
| Interquartile 25% (IQ1) | 46.0% | 40.8% |
| Interquartile 75% (IQ3) | 65.6% | 49.2% |
| Interquartile Range (IQR) | 19.6% | 8.5% |
| Standard Deviation (Sample) | 20.3% | 10.9% |
| Standard Deviation (Population) | 20.1% | 10.8% |
Similar Demographics by Married-couple Households
Demographics Similar to Canadians by Married-couple Households
In terms of married-couple households, the demographic groups most similar to Canadians are Egyptian (48.2%, a difference of 0.020%), Immigrants from Netherlands (48.2%, a difference of 0.030%), Russian (48.2%, a difference of 0.050%), Immigrants from England (48.2%, a difference of 0.10%), and Immigrants from Fiji (48.2%, a difference of 0.10%).
| Demographics | Rating | Rank | Married-couple Households |
| Immigrants | North America | 98.9 /100 | #70 | Exceptional 48.4% |
| Laotians | 98.8 /100 | #71 | Exceptional 48.4% |
| Scotch-Irish | 98.6 /100 | #72 | Exceptional 48.3% |
| Immigrants | Singapore | 98.6 /100 | #73 | Exceptional 48.3% |
| Immigrants | Romania | 98.6 /100 | #74 | Exceptional 48.3% |
| Immigrants | England | 98.4 /100 | #75 | Exceptional 48.2% |
| Immigrants | Fiji | 98.4 /100 | #76 | Exceptional 48.2% |
| Canadians | 98.2 /100 | #77 | Exceptional 48.2% |
| Egyptians | 98.2 /100 | #78 | Exceptional 48.2% |
| Immigrants | Netherlands | 98.2 /100 | #79 | Exceptional 48.2% |
| Russians | 98.1 /100 | #80 | Exceptional 48.2% |
| Finns | 98.0 /100 | #81 | Exceptional 48.1% |
| Immigrants | Poland | 97.7 /100 | #82 | Exceptional 48.1% |
| Guamanians/Chamorros | 97.6 /100 | #83 | Exceptional 48.1% |
| Ukrainians | 97.6 /100 | #84 | Exceptional 48.1% |
Demographics Similar to Immigrants from Ecuador by Married-couple Households
In terms of married-couple households, the demographic groups most similar to Immigrants from Ecuador are Sierra Leonean (42.9%, a difference of 0.050%), Immigrants from Guatemala (42.8%, a difference of 0.070%), Immigrants from Africa (42.9%, a difference of 0.080%), Immigrants from Eastern Africa (42.9%, a difference of 0.19%), and Immigrants from Ethiopia (43.1%, a difference of 0.45%).
| Demographics | Rating | Rank | Married-couple Households |
| Ethiopians | 0.1 /100 | #273 | Tragic 43.2% |
| Nigerians | 0.1 /100 | #274 | Tragic 43.2% |
| Immigrants | Bangladesh | 0.0 /100 | #275 | Tragic 43.1% |
| Immigrants | Ethiopia | 0.0 /100 | #276 | Tragic 43.1% |
| Immigrants | Eastern Africa | 0.0 /100 | #277 | Tragic 42.9% |
| Immigrants | Africa | 0.0 /100 | #278 | Tragic 42.9% |
| Sierra Leoneans | 0.0 /100 | #279 | Tragic 42.9% |
| Immigrants | Ecuador | 0.0 /100 | #280 | Tragic 42.9% |
| Immigrants | Guatemala | 0.0 /100 | #281 | Tragic 42.8% |
| Bermudans | 0.0 /100 | #282 | Tragic 42.4% |
| Inupiat | 0.0 /100 | #283 | Tragic 42.4% |
| Cheyenne | 0.0 /100 | #284 | Tragic 42.3% |
| Ghanaians | 0.0 /100 | #285 | Tragic 42.2% |
| Belizeans | 0.0 /100 | #286 | Tragic 42.2% |
| Chippewa | 0.0 /100 | #287 | Tragic 42.1% |