Cajun vs Russian Family Households
COMPARE
Cajun
Russian
Family Households
Family Households Comparison
Cajuns
Russians
64.8%
FAMILY HOUSEHOLDS
89.4/ 100
METRIC RATING
132nd/ 347
METRIC RANK
63.4%
FAMILY HOUSEHOLDS
1.4/ 100
METRIC RATING
249th/ 347
METRIC RANK
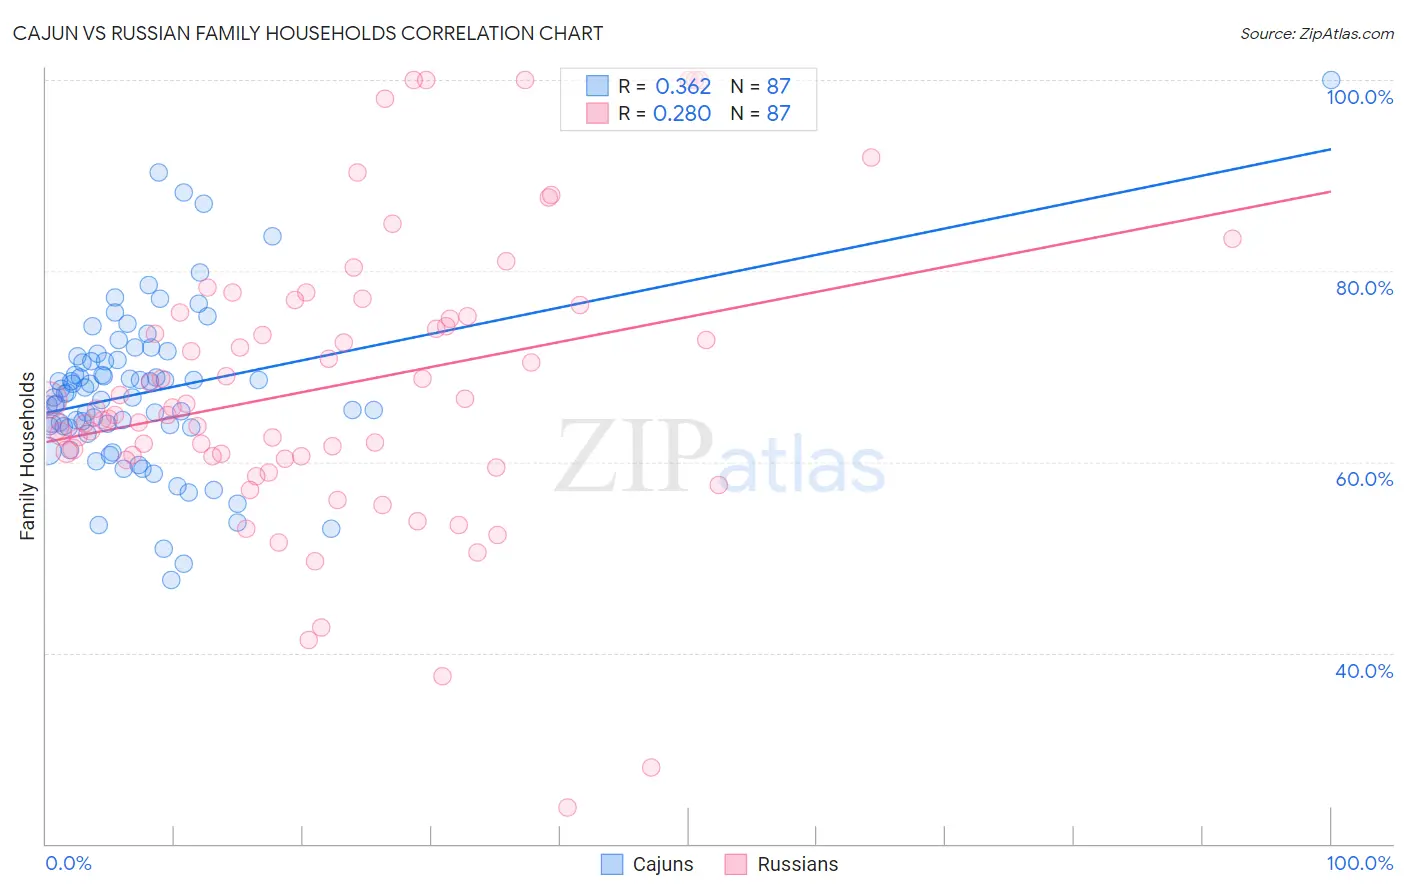
Cajun vs Russian Family Households Correlation Chart
The statistical analysis conducted on geographies consisting of 149,695,707 people shows a mild positive correlation between the proportion of Cajuns and percentage of family households in the United States with a correlation coefficient (R) of 0.362 and weighted average of 64.8%. Similarly, the statistical analysis conducted on geographies consisting of 511,741,989 people shows a weak positive correlation between the proportion of Russians and percentage of family households in the United States with a correlation coefficient (R) of 0.280 and weighted average of 63.4%, a difference of 2.2%.
Family Households Correlation Summary
| Measurement | Cajun | Russian |
| Minimum | 47.6% | 23.8% |
| Maximum | 100.0% | 100.0% |
| Range | 52.4% | 76.2% |
| Mean | 67.3% | 68.0% |
| Median | 67.2% | 65.5% |
| Interquartile 25% (IQ1) | 63.6% | 60.6% |
| Interquartile 75% (IQ3) | 70.7% | 75.7% |
| Interquartile Range (IQR) | 7.1% | 15.1% |
| Standard Deviation (Sample) | 8.6% | 15.2% |
| Standard Deviation (Population) | 8.6% | 15.1% |
Similar Demographics by Family Households
Demographics Similar to Cajuns by Family Households
In terms of family households, the demographic groups most similar to Cajuns are Belizean (64.8%, a difference of 0.0%), Nonimmigrants (64.8%, a difference of 0.020%), Immigrants from Italy (64.8%, a difference of 0.030%), Greek (64.7%, a difference of 0.040%), and Maltese (64.7%, a difference of 0.060%).
| Demographics | Rating | Rank | Family Households |
| Immigrants | Belize | 92.7 /100 | #125 | Exceptional 64.9% |
| Panamanians | 92.4 /100 | #126 | Exceptional 64.8% |
| Immigrants | Panama | 92.0 /100 | #127 | Exceptional 64.8% |
| Italians | 91.9 /100 | #128 | Exceptional 64.8% |
| Immigrants | Ecuador | 91.4 /100 | #129 | Exceptional 64.8% |
| Immigrants | Italy | 90.2 /100 | #130 | Exceptional 64.8% |
| Immigrants | Nonimmigrants | 90.1 /100 | #131 | Exceptional 64.8% |
| Cajuns | 89.4 /100 | #132 | Excellent 64.8% |
| Belizeans | 89.3 /100 | #133 | Excellent 64.8% |
| Greeks | 88.1 /100 | #134 | Excellent 64.7% |
| Maltese | 87.4 /100 | #135 | Excellent 64.7% |
| Immigrants | China | 86.6 /100 | #136 | Excellent 64.7% |
| Immigrants | Scotland | 86.4 /100 | #137 | Excellent 64.7% |
| Basques | 85.5 /100 | #138 | Excellent 64.7% |
| Immigrants | Jamaica | 85.3 /100 | #139 | Excellent 64.7% |
Demographics Similar to Russians by Family Households
In terms of family households, the demographic groups most similar to Russians are Dominican (63.4%, a difference of 0.010%), Immigrants from Japan (63.4%, a difference of 0.010%), Immigrants from Uzbekistan (63.4%, a difference of 0.020%), Immigrants from Ghana (63.4%, a difference of 0.030%), and Eastern European (63.4%, a difference of 0.050%).
| Demographics | Rating | Rank | Family Households |
| Immigrants | Israel | 1.8 /100 | #242 | Tragic 63.4% |
| Immigrants | Czechoslovakia | 1.8 /100 | #243 | Tragic 63.4% |
| Eastern Europeans | 1.6 /100 | #244 | Tragic 63.4% |
| Immigrants | Dominica | 1.6 /100 | #245 | Tragic 63.4% |
| Immigrants | Ghana | 1.6 /100 | #246 | Tragic 63.4% |
| Immigrants | Uzbekistan | 1.5 /100 | #247 | Tragic 63.4% |
| Dominicans | 1.5 /100 | #248 | Tragic 63.4% |
| Russians | 1.4 /100 | #249 | Tragic 63.4% |
| Immigrants | Japan | 1.4 /100 | #250 | Tragic 63.4% |
| Taiwanese | 1.2 /100 | #251 | Tragic 63.3% |
| Bahamians | 1.1 /100 | #252 | Tragic 63.3% |
| Immigrants | Dominican Republic | 1.0 /100 | #253 | Tragic 63.3% |
| Slovaks | 1.0 /100 | #254 | Tragic 63.3% |
| Potawatomi | 1.0 /100 | #255 | Tragic 63.3% |
| Luxembourgers | 0.9 /100 | #256 | Tragic 63.3% |