Immigrants from Sweden vs Russian Family Households
COMPARE
Immigrants from Sweden
Russian
Family Households
Family Households Comparison
Immigrants from Sweden
Russians
62.5%
FAMILY HOUSEHOLDS
0.0/ 100
METRIC RATING
293rd/ 347
METRIC RANK
63.4%
FAMILY HOUSEHOLDS
1.4/ 100
METRIC RATING
249th/ 347
METRIC RANK
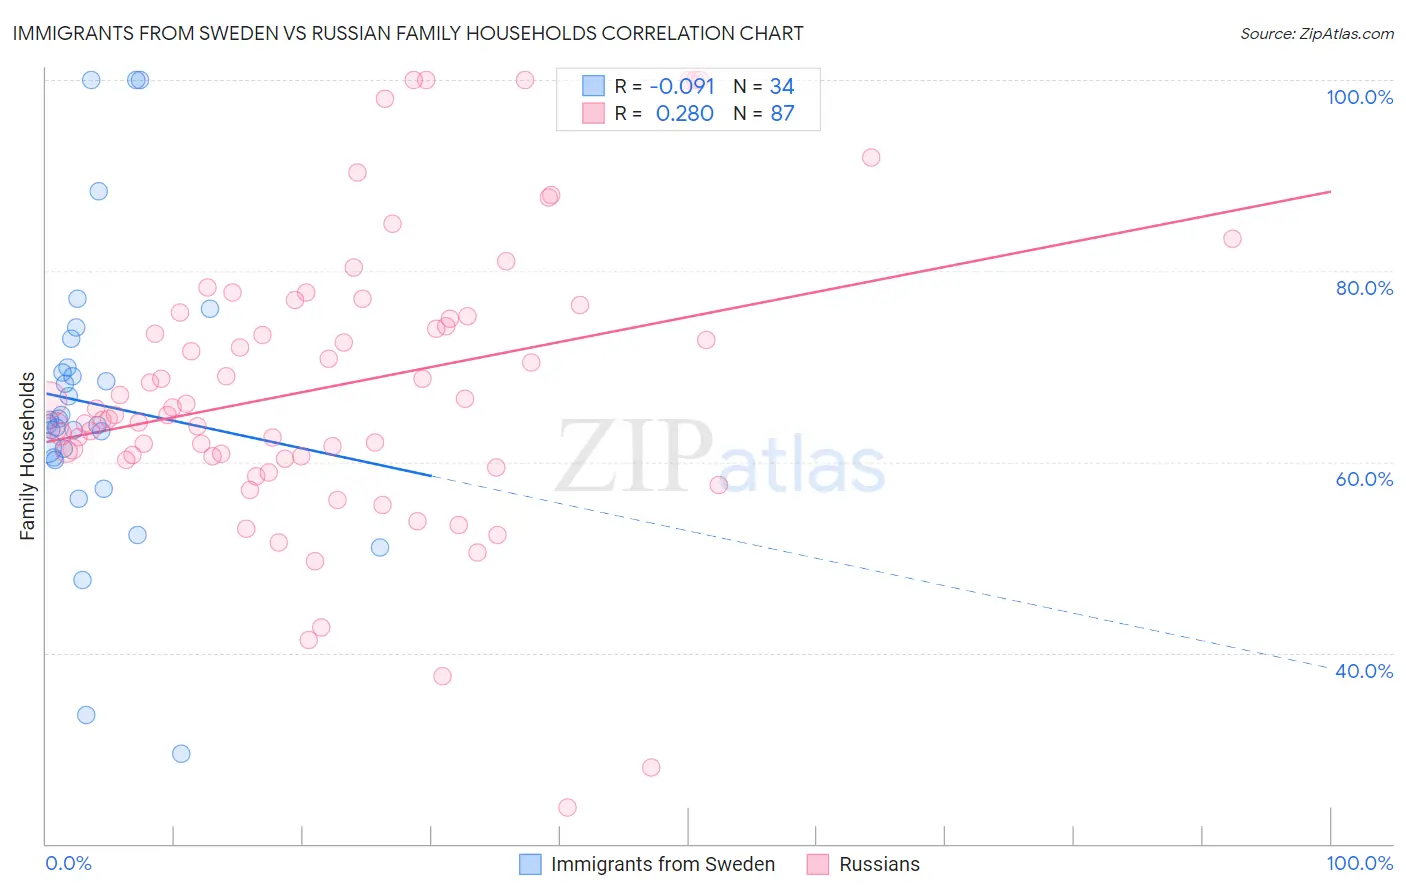
Immigrants from Sweden vs Russian Family Households Correlation Chart
The statistical analysis conducted on geographies consisting of 164,705,416 people shows a slight negative correlation between the proportion of Immigrants from Sweden and percentage of family households in the United States with a correlation coefficient (R) of -0.091 and weighted average of 62.5%. Similarly, the statistical analysis conducted on geographies consisting of 511,741,989 people shows a weak positive correlation between the proportion of Russians and percentage of family households in the United States with a correlation coefficient (R) of 0.280 and weighted average of 63.4%, a difference of 1.4%.
Family Households Correlation Summary
| Measurement | Immigrants from Sweden | Russian |
| Minimum | 29.4% | 23.8% |
| Maximum | 100.0% | 100.0% |
| Range | 70.6% | 76.2% |
| Mean | 66.1% | 68.0% |
| Median | 64.2% | 65.5% |
| Interquartile 25% (IQ1) | 60.5% | 60.6% |
| Interquartile 75% (IQ3) | 69.9% | 75.7% |
| Interquartile Range (IQR) | 9.4% | 15.1% |
| Standard Deviation (Sample) | 15.4% | 15.2% |
| Standard Deviation (Population) | 15.2% | 15.1% |
Similar Demographics by Family Households
Demographics Similar to Immigrants from Sweden by Family Households
In terms of family households, the demographic groups most similar to Immigrants from Sweden are Barbadian (62.5%, a difference of 0.060%), Okinawan (62.5%, a difference of 0.080%), Slovene (62.4%, a difference of 0.090%), French American Indian (62.4%, a difference of 0.10%), and Immigrants from Burma/Myanmar (62.6%, a difference of 0.13%).
| Demographics | Rating | Rank | Family Households |
| British West Indians | 0.1 /100 | #286 | Tragic 62.8% |
| Latvians | 0.1 /100 | #287 | Tragic 62.8% |
| Immigrants | Uganda | 0.1 /100 | #288 | Tragic 62.7% |
| Immigrants | Nepal | 0.1 /100 | #289 | Tragic 62.7% |
| Immigrants | Grenada | 0.0 /100 | #290 | Tragic 62.6% |
| U.S. Virgin Islanders | 0.0 /100 | #291 | Tragic 62.6% |
| Immigrants | Burma/Myanmar | 0.0 /100 | #292 | Tragic 62.6% |
| Immigrants | Sweden | 0.0 /100 | #293 | Tragic 62.5% |
| Barbadians | 0.0 /100 | #294 | Tragic 62.5% |
| Okinawans | 0.0 /100 | #295 | Tragic 62.5% |
| Slovenes | 0.0 /100 | #296 | Tragic 62.4% |
| French American Indians | 0.0 /100 | #297 | Tragic 62.4% |
| Immigrants | Spain | 0.0 /100 | #298 | Tragic 62.4% |
| Immigrants | Kuwait | 0.0 /100 | #299 | Tragic 62.4% |
| Immigrants | Africa | 0.0 /100 | #300 | Tragic 62.4% |
Demographics Similar to Russians by Family Households
In terms of family households, the demographic groups most similar to Russians are Dominican (63.4%, a difference of 0.010%), Immigrants from Japan (63.4%, a difference of 0.010%), Immigrants from Uzbekistan (63.4%, a difference of 0.020%), Immigrants from Ghana (63.4%, a difference of 0.030%), and Eastern European (63.4%, a difference of 0.050%).
| Demographics | Rating | Rank | Family Households |
| Immigrants | Israel | 1.8 /100 | #242 | Tragic 63.4% |
| Immigrants | Czechoslovakia | 1.8 /100 | #243 | Tragic 63.4% |
| Eastern Europeans | 1.6 /100 | #244 | Tragic 63.4% |
| Immigrants | Dominica | 1.6 /100 | #245 | Tragic 63.4% |
| Immigrants | Ghana | 1.6 /100 | #246 | Tragic 63.4% |
| Immigrants | Uzbekistan | 1.5 /100 | #247 | Tragic 63.4% |
| Dominicans | 1.5 /100 | #248 | Tragic 63.4% |
| Russians | 1.4 /100 | #249 | Tragic 63.4% |
| Immigrants | Japan | 1.4 /100 | #250 | Tragic 63.4% |
| Taiwanese | 1.2 /100 | #251 | Tragic 63.3% |
| Bahamians | 1.1 /100 | #252 | Tragic 63.3% |
| Immigrants | Dominican Republic | 1.0 /100 | #253 | Tragic 63.3% |
| Slovaks | 1.0 /100 | #254 | Tragic 63.3% |
| Potawatomi | 1.0 /100 | #255 | Tragic 63.3% |
| Luxembourgers | 0.9 /100 | #256 | Tragic 63.3% |