Cajun vs Russian No Vehicles in Household
COMPARE
Cajun
Russian
No Vehicles in Household
No Vehicles in Household Comparison
Cajuns
Russians
8.4%
NO VEHICLES IN HOUSEHOLD
99.6/ 100
METRIC RATING
70th/ 347
METRIC RANK
11.6%
NO VEHICLES IN HOUSEHOLD
3.2/ 100
METRIC RATING
238th/ 347
METRIC RANK
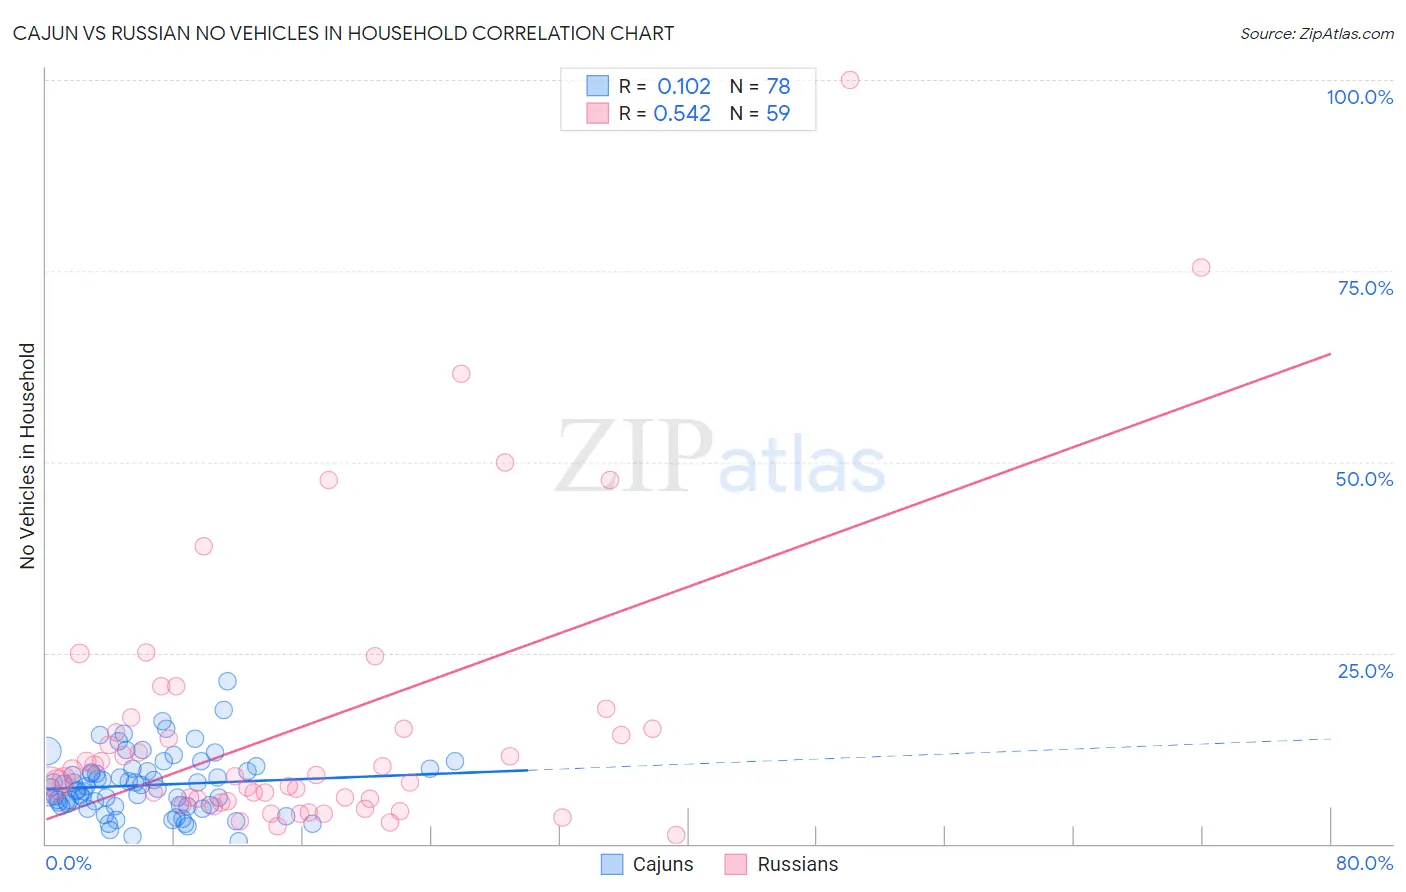
Cajun vs Russian No Vehicles in Household Correlation Chart
The statistical analysis conducted on geographies consisting of 149,490,640 people shows a poor positive correlation between the proportion of Cajuns and percentage of households with no vehicle available in the United States with a correlation coefficient (R) of 0.102 and weighted average of 8.4%. Similarly, the statistical analysis conducted on geographies consisting of 509,184,789 people shows a substantial positive correlation between the proportion of Russians and percentage of households with no vehicle available in the United States with a correlation coefficient (R) of 0.542 and weighted average of 11.6%, a difference of 37.7%.
No Vehicles in Household Correlation Summary
| Measurement | Cajun | Russian |
| Minimum | 0.38% | 1.2% |
| Maximum | 21.2% | 100.0% |
| Range | 20.8% | 98.8% |
| Mean | 7.7% | 15.6% |
| Median | 7.3% | 8.8% |
| Interquartile 25% (IQ1) | 5.0% | 5.6% |
| Interquartile 75% (IQ3) | 9.5% | 15.0% |
| Interquartile Range (IQR) | 4.5% | 9.4% |
| Standard Deviation (Sample) | 3.9% | 18.7% |
| Standard Deviation (Population) | 3.9% | 18.6% |
Similar Demographics by No Vehicles in Household
Demographics Similar to Cajuns by No Vehicles in Household
In terms of no vehicles in household, the demographic groups most similar to Cajuns are Immigrants from Lebanon (8.4%, a difference of 0.030%), Lithuanian (8.4%, a difference of 0.060%), Polish (8.4%, a difference of 0.090%), Spaniard (8.4%, a difference of 0.72%), and Immigrants from Iran (8.4%, a difference of 0.78%).
| Demographics | Rating | Rank | No Vehicles in Household |
| Slovaks | 99.8 /100 | #63 | Exceptional 8.3% |
| Croatians | 99.8 /100 | #64 | Exceptional 8.3% |
| Canadians | 99.7 /100 | #65 | Exceptional 8.3% |
| Palestinians | 99.7 /100 | #66 | Exceptional 8.3% |
| Immigrants | Scotland | 99.7 /100 | #67 | Exceptional 8.3% |
| Immigrants | Iran | 99.7 /100 | #68 | Exceptional 8.4% |
| Spaniards | 99.7 /100 | #69 | Exceptional 8.4% |
| Cajuns | 99.6 /100 | #70 | Exceptional 8.4% |
| Immigrants | Lebanon | 99.6 /100 | #71 | Exceptional 8.4% |
| Lithuanians | 99.6 /100 | #72 | Exceptional 8.4% |
| Poles | 99.6 /100 | #73 | Exceptional 8.4% |
| Cubans | 99.5 /100 | #74 | Exceptional 8.5% |
| Jordanians | 99.5 /100 | #75 | Exceptional 8.5% |
| Immigrants | Philippines | 99.5 /100 | #76 | Exceptional 8.5% |
| Iranians | 99.5 /100 | #77 | Exceptional 8.6% |
Demographics Similar to Russians by No Vehicles in Household
In terms of no vehicles in household, the demographic groups most similar to Russians are Ute (11.6%, a difference of 0.050%), Cree (11.6%, a difference of 0.29%), Taiwanese (11.7%, a difference of 0.46%), Immigrants (11.7%, a difference of 0.52%), and Eastern European (11.7%, a difference of 0.53%).
| Demographics | Rating | Rank | No Vehicles in Household |
| Immigrants | Japan | 5.1 /100 | #231 | Tragic 11.4% |
| Immigrants | Turkey | 4.8 /100 | #232 | Tragic 11.5% |
| Houma | 4.7 /100 | #233 | Tragic 11.5% |
| Immigrants | Peru | 4.5 /100 | #234 | Tragic 11.5% |
| Kiowa | 4.0 /100 | #235 | Tragic 11.5% |
| Cree | 3.5 /100 | #236 | Tragic 11.6% |
| Ute | 3.3 /100 | #237 | Tragic 11.6% |
| Russians | 3.2 /100 | #238 | Tragic 11.6% |
| Taiwanese | 2.8 /100 | #239 | Tragic 11.7% |
| Immigrants | Immigrants | 2.7 /100 | #240 | Tragic 11.7% |
| Eastern Europeans | 2.7 /100 | #241 | Tragic 11.7% |
| Turks | 2.6 /100 | #242 | Tragic 11.7% |
| Cheyenne | 2.4 /100 | #243 | Tragic 11.7% |
| Immigrants | Portugal | 2.2 /100 | #244 | Tragic 11.7% |
| Immigrants | Honduras | 2.1 /100 | #245 | Tragic 11.8% |