Carpatho Rusyn vs Immigrants from Lebanon Average Family Size
COMPARE
Carpatho Rusyn
Immigrants from Lebanon
Average Family Size
Average Family Size Comparison
Carpatho Rusyns
Immigrants from Lebanon
3.06
AVERAGE FAMILY SIZE
0.0/ 100
METRIC RATING
347th/ 347
METRIC RANK
3.30
AVERAGE FAMILY SIZE
99.0/ 100
METRIC RATING
95th/ 347
METRIC RANK
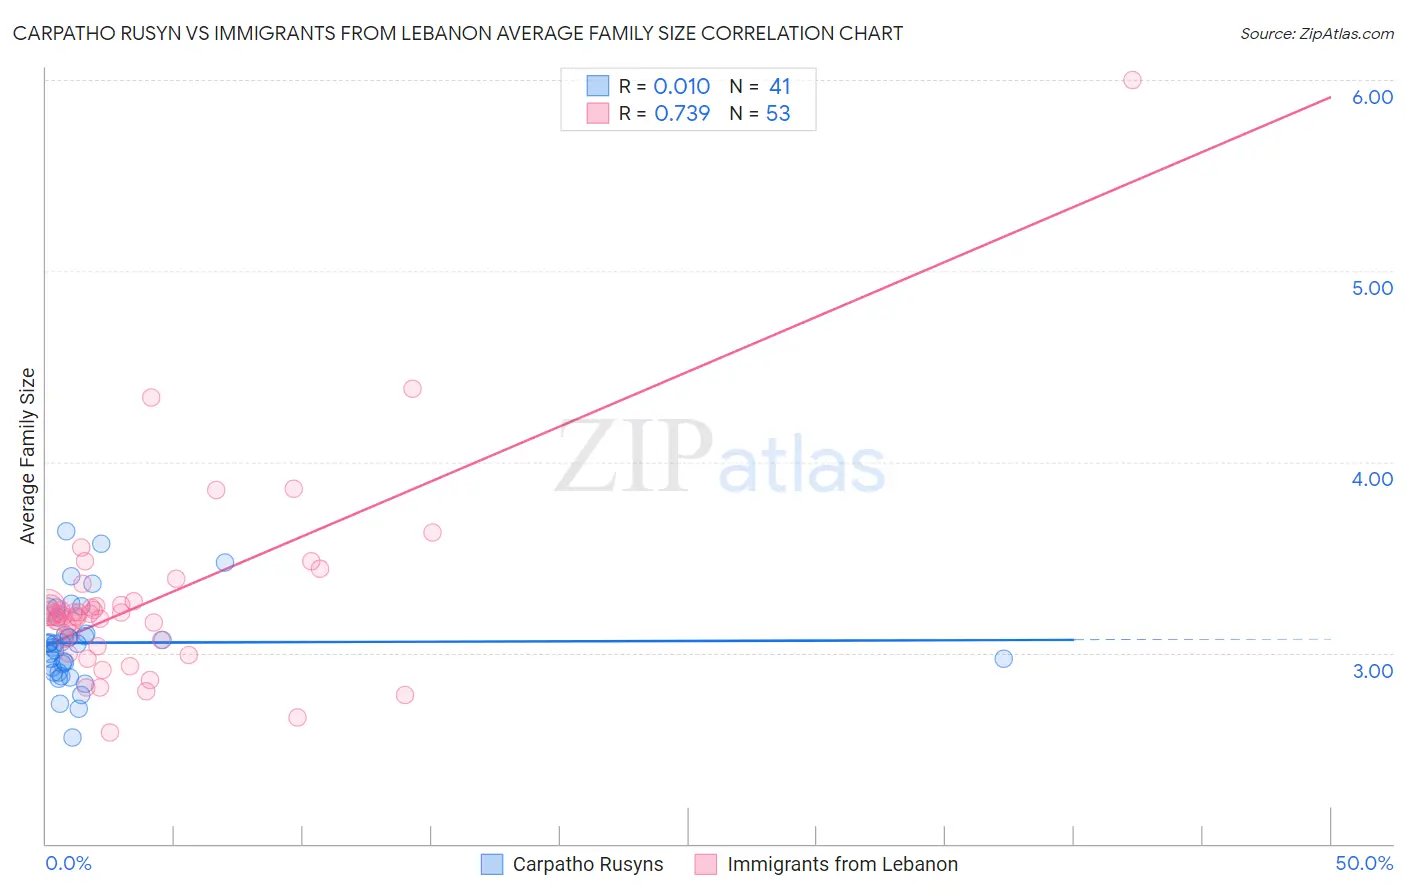
Carpatho Rusyn vs Immigrants from Lebanon Average Family Size Correlation Chart
The statistical analysis conducted on geographies consisting of 58,871,605 people shows no correlation between the proportion of Carpatho Rusyns and average family size in the United States with a correlation coefficient (R) of 0.010 and weighted average of 3.06. Similarly, the statistical analysis conducted on geographies consisting of 217,130,535 people shows a strong positive correlation between the proportion of Immigrants from Lebanon and average family size in the United States with a correlation coefficient (R) of 0.739 and weighted average of 3.30, a difference of 7.6%.
Average Family Size Correlation Summary
| Measurement | Carpatho Rusyn | Immigrants from Lebanon |
| Minimum | 2.56 | 2.58 |
| Maximum | 3.64 | 6.00 |
| Range | 1.08 | 3.42 |
| Mean | 3.05 | 3.27 |
| Median | 3.05 | 3.20 |
| Interquartile 25% (IQ1) | 2.91 | 3.05 |
| Interquartile 75% (IQ3) | 3.14 | 3.26 |
| Interquartile Range (IQR) | 0.23 | 0.21 |
| Standard Deviation (Sample) | 0.22 | 0.51 |
| Standard Deviation (Population) | 0.22 | 0.51 |
Similar Demographics by Average Family Size
Demographics Similar to Carpatho Rusyns by Average Family Size
In terms of average family size, the demographic groups most similar to Carpatho Rusyns are Slovak (3.06, a difference of 0.060%), Slovene (3.07, a difference of 0.35%), French Canadian (3.07, a difference of 0.39%), Norwegian (3.08, a difference of 0.63%), and German (3.09, a difference of 0.86%).
| Demographics | Rating | Rank | Average Family Size |
| Estonians | 0.0 /100 | #333 | Tragic 3.10 |
| Lithuanians | 0.0 /100 | #334 | Tragic 3.10 |
| Luxembourgers | 0.0 /100 | #335 | Tragic 3.10 |
| Irish | 0.0 /100 | #336 | Tragic 3.10 |
| Swedes | 0.0 /100 | #337 | Tragic 3.10 |
| French | 0.0 /100 | #338 | Tragic 3.10 |
| Croatians | 0.0 /100 | #339 | Tragic 3.10 |
| Finns | 0.0 /100 | #340 | Tragic 3.09 |
| Poles | 0.0 /100 | #341 | Tragic 3.09 |
| Germans | 0.0 /100 | #342 | Tragic 3.09 |
| Norwegians | 0.0 /100 | #343 | Tragic 3.08 |
| French Canadians | 0.0 /100 | #344 | Tragic 3.07 |
| Slovenes | 0.0 /100 | #345 | Tragic 3.07 |
| Slovaks | 0.0 /100 | #346 | Tragic 3.06 |
| Carpatho Rusyns | 0.0 /100 | #347 | Tragic 3.06 |
Demographics Similar to Immigrants from Lebanon by Average Family Size
In terms of average family size, the demographic groups most similar to Immigrants from Lebanon are Sierra Leonean (3.30, a difference of 0.010%), U.S. Virgin Islander (3.29, a difference of 0.080%), Peruvian (3.30, a difference of 0.11%), Immigrants from Cameroon (3.30, a difference of 0.12%), and Immigrants from Oceania (3.29, a difference of 0.12%).
| Demographics | Rating | Rank | Average Family Size |
| Immigrants | Bolivia | 99.6 /100 | #88 | Exceptional 3.31 |
| Malaysians | 99.6 /100 | #89 | Exceptional 3.31 |
| Menominee | 99.4 /100 | #90 | Exceptional 3.30 |
| Immigrants | Pakistan | 99.2 /100 | #91 | Exceptional 3.30 |
| Immigrants | Cameroon | 99.2 /100 | #92 | Exceptional 3.30 |
| Peruvians | 99.2 /100 | #93 | Exceptional 3.30 |
| Sierra Leoneans | 99.0 /100 | #94 | Exceptional 3.30 |
| Immigrants | Lebanon | 99.0 /100 | #95 | Exceptional 3.30 |
| U.S. Virgin Islanders | 98.8 /100 | #96 | Exceptional 3.29 |
| Immigrants | Oceania | 98.7 /100 | #97 | Exceptional 3.29 |
| Barbadians | 98.6 /100 | #98 | Exceptional 3.29 |
| Nigerians | 98.6 /100 | #99 | Exceptional 3.29 |
| Guamanians/Chamorros | 98.6 /100 | #100 | Exceptional 3.29 |
| Immigrants | Burma/Myanmar | 98.6 /100 | #101 | Exceptional 3.29 |
| West Indians | 98.5 /100 | #102 | Exceptional 3.29 |