British vs Iroquois Divorced or Separated
COMPARE
British
Iroquois
Divorced or Separated
Divorced or Separated Comparison
British
Iroquois
12.3%
DIVORCED OR SEPARATED
11.6/ 100
METRIC RATING
220th/ 347
METRIC RANK
12.9%
DIVORCED OR SEPARATED
0.0/ 100
METRIC RATING
289th/ 347
METRIC RANK
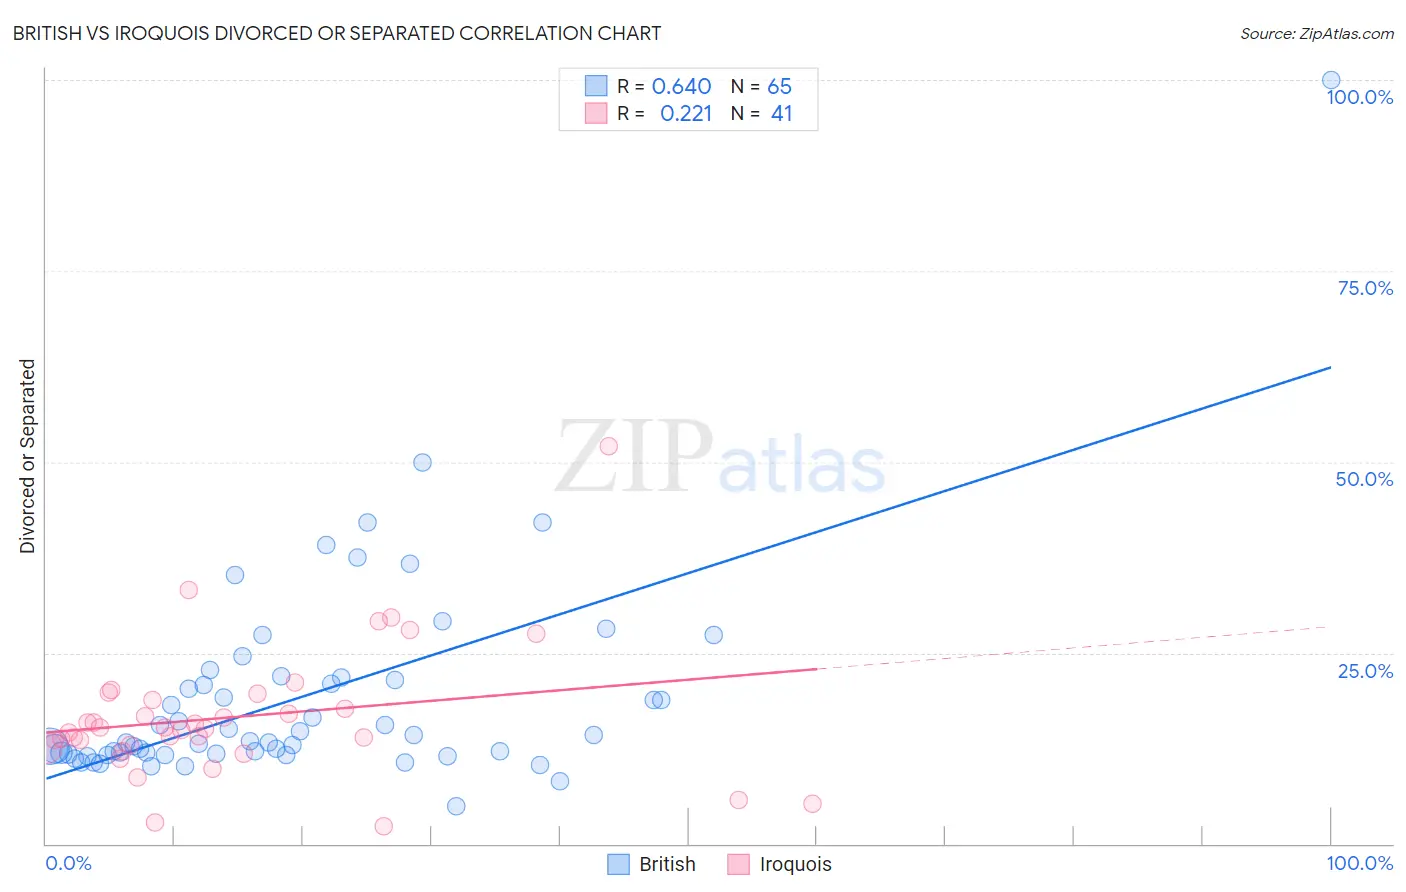
British vs Iroquois Divorced or Separated Correlation Chart
The statistical analysis conducted on geographies consisting of 531,128,127 people shows a significant positive correlation between the proportion of British and percentage of population currently divorced or separated in the United States with a correlation coefficient (R) of 0.640 and weighted average of 12.3%. Similarly, the statistical analysis conducted on geographies consisting of 207,262,032 people shows a weak positive correlation between the proportion of Iroquois and percentage of population currently divorced or separated in the United States with a correlation coefficient (R) of 0.221 and weighted average of 12.9%, a difference of 4.9%.
Divorced or Separated Correlation Summary
| Measurement | British | Iroquois |
| Minimum | 4.9% | 2.3% |
| Maximum | 100.0% | 52.0% |
| Range | 95.1% | 49.7% |
| Mean | 19.2% | 16.6% |
| Median | 13.4% | 15.0% |
| Interquartile 25% (IQ1) | 11.8% | 12.8% |
| Interquartile 75% (IQ3) | 21.6% | 19.2% |
| Interquartile Range (IQR) | 9.8% | 6.4% |
| Standard Deviation (Sample) | 13.9% | 8.8% |
| Standard Deviation (Population) | 13.8% | 8.7% |
Similar Demographics by Divorced or Separated
Demographics Similar to British by Divorced or Separated
In terms of divorced or separated, the demographic groups most similar to British are Czechoslovakian (12.3%, a difference of 0.010%), Guamanian/Chamorro (12.3%, a difference of 0.030%), Bangladeshi (12.3%, a difference of 0.10%), Scandinavian (12.3%, a difference of 0.11%), and Slovene (12.3%, a difference of 0.12%).
| Demographics | Rating | Rank | Divorced or Separated |
| Immigrants | Eastern Africa | 16.2 /100 | #213 | Poor 12.2% |
| Immigrants | Argentina | 15.5 /100 | #214 | Poor 12.2% |
| Europeans | 15.4 /100 | #215 | Poor 12.2% |
| Immigrants | South America | 15.4 /100 | #216 | Poor 12.2% |
| Northern Europeans | 14.7 /100 | #217 | Poor 12.2% |
| Slovenes | 13.2 /100 | #218 | Poor 12.3% |
| Czechoslovakians | 11.7 /100 | #219 | Poor 12.3% |
| British | 11.6 /100 | #220 | Poor 12.3% |
| Guamanians/Chamorros | 11.3 /100 | #221 | Poor 12.3% |
| Bangladeshis | 10.5 /100 | #222 | Poor 12.3% |
| Scandinavians | 10.4 /100 | #223 | Poor 12.3% |
| Immigrants | Azores | 9.7 /100 | #224 | Tragic 12.3% |
| Belgians | 9.7 /100 | #225 | Tragic 12.3% |
| Immigrants | Western Africa | 9.3 /100 | #226 | Tragic 12.3% |
| Hmong | 8.8 /100 | #227 | Tragic 12.3% |
Demographics Similar to Iroquois by Divorced or Separated
In terms of divorced or separated, the demographic groups most similar to Iroquois are Pima (12.9%, a difference of 0.14%), French Canadian (12.8%, a difference of 0.15%), Immigrants from Honduras (12.9%, a difference of 0.26%), Scotch-Irish (12.9%, a difference of 0.32%), and Honduran (12.8%, a difference of 0.41%).
| Demographics | Rating | Rank | Divorced or Separated |
| Sub-Saharan Africans | 0.1 /100 | #282 | Tragic 12.7% |
| Delaware | 0.1 /100 | #283 | Tragic 12.7% |
| Immigrants | Nonimmigrants | 0.1 /100 | #284 | Tragic 12.8% |
| French | 0.1 /100 | #285 | Tragic 12.8% |
| Spanish | 0.1 /100 | #286 | Tragic 12.8% |
| Hondurans | 0.1 /100 | #287 | Tragic 12.8% |
| French Canadians | 0.1 /100 | #288 | Tragic 12.8% |
| Iroquois | 0.0 /100 | #289 | Tragic 12.9% |
| Pima | 0.0 /100 | #290 | Tragic 12.9% |
| Immigrants | Honduras | 0.0 /100 | #291 | Tragic 12.9% |
| Scotch-Irish | 0.0 /100 | #292 | Tragic 12.9% |
| Jamaicans | 0.0 /100 | #293 | Tragic 12.9% |
| Apache | 0.0 /100 | #294 | Tragic 12.9% |
| Celtics | 0.0 /100 | #295 | Tragic 13.0% |
| Nicaraguans | 0.0 /100 | #296 | Tragic 13.0% |