British vs Taiwanese Divorced or Separated
COMPARE
British
Taiwanese
Divorced or Separated
Divorced or Separated Comparison
British
Taiwanese
12.3%
DIVORCED OR SEPARATED
11.6/ 100
METRIC RATING
220th/ 347
METRIC RANK
11.5%
DIVORCED OR SEPARATED
99.6/ 100
METRIC RATING
74th/ 347
METRIC RANK
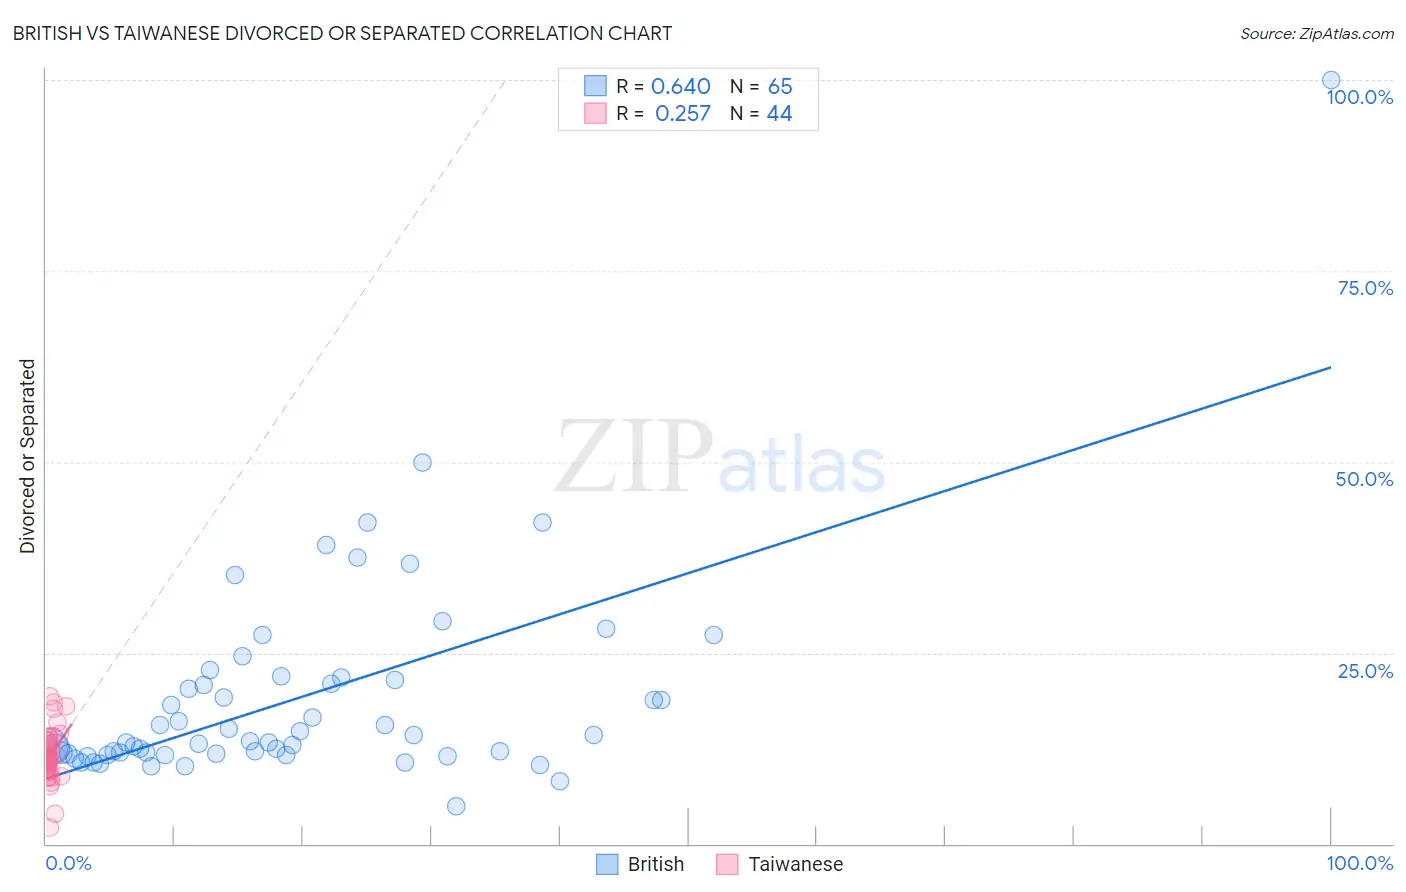
British vs Taiwanese Divorced or Separated Correlation Chart
The statistical analysis conducted on geographies consisting of 531,128,127 people shows a significant positive correlation between the proportion of British and percentage of population currently divorced or separated in the United States with a correlation coefficient (R) of 0.640 and weighted average of 12.3%. Similarly, the statistical analysis conducted on geographies consisting of 31,709,765 people shows a weak positive correlation between the proportion of Taiwanese and percentage of population currently divorced or separated in the United States with a correlation coefficient (R) of 0.257 and weighted average of 11.5%, a difference of 6.9%.
Divorced or Separated Correlation Summary
| Measurement | British | Taiwanese |
| Minimum | 4.9% | 2.2% |
| Maximum | 100.0% | 19.3% |
| Range | 95.1% | 17.1% |
| Mean | 19.2% | 11.5% |
| Median | 13.4% | 11.1% |
| Interquartile 25% (IQ1) | 11.8% | 9.7% |
| Interquartile 75% (IQ3) | 21.6% | 13.3% |
| Interquartile Range (IQR) | 9.8% | 3.5% |
| Standard Deviation (Sample) | 13.9% | 3.3% |
| Standard Deviation (Population) | 13.8% | 3.3% |
Similar Demographics by Divorced or Separated
Demographics Similar to British by Divorced or Separated
In terms of divorced or separated, the demographic groups most similar to British are Czechoslovakian (12.3%, a difference of 0.010%), Guamanian/Chamorro (12.3%, a difference of 0.030%), Bangladeshi (12.3%, a difference of 0.10%), Scandinavian (12.3%, a difference of 0.11%), and Slovene (12.3%, a difference of 0.12%).
| Demographics | Rating | Rank | Divorced or Separated |
| Immigrants | Eastern Africa | 16.2 /100 | #213 | Poor 12.2% |
| Immigrants | Argentina | 15.5 /100 | #214 | Poor 12.2% |
| Europeans | 15.4 /100 | #215 | Poor 12.2% |
| Immigrants | South America | 15.4 /100 | #216 | Poor 12.2% |
| Northern Europeans | 14.7 /100 | #217 | Poor 12.2% |
| Slovenes | 13.2 /100 | #218 | Poor 12.3% |
| Czechoslovakians | 11.7 /100 | #219 | Poor 12.3% |
| British | 11.6 /100 | #220 | Poor 12.3% |
| Guamanians/Chamorros | 11.3 /100 | #221 | Poor 12.3% |
| Bangladeshis | 10.5 /100 | #222 | Poor 12.3% |
| Scandinavians | 10.4 /100 | #223 | Poor 12.3% |
| Immigrants | Azores | 9.7 /100 | #224 | Tragic 12.3% |
| Belgians | 9.7 /100 | #225 | Tragic 12.3% |
| Immigrants | Western Africa | 9.3 /100 | #226 | Tragic 12.3% |
| Hmong | 8.8 /100 | #227 | Tragic 12.3% |
Demographics Similar to Taiwanese by Divorced or Separated
In terms of divorced or separated, the demographic groups most similar to Taiwanese are Jordanian (11.5%, a difference of 0.060%), Immigrants from North Macedonia (11.5%, a difference of 0.060%), Immigrants from Northern Africa (11.5%, a difference of 0.080%), Albanian (11.5%, a difference of 0.10%), and Paraguayan (11.5%, a difference of 0.13%).
| Demographics | Rating | Rank | Divorced or Separated |
| Immigrants | Syria | 99.7 /100 | #67 | Exceptional 11.4% |
| Palestinians | 99.7 /100 | #68 | Exceptional 11.5% |
| Immigrants | Belgium | 99.7 /100 | #69 | Exceptional 11.5% |
| Immigrants | Eastern Europe | 99.7 /100 | #70 | Exceptional 11.5% |
| Paraguayans | 99.7 /100 | #71 | Exceptional 11.5% |
| Jordanians | 99.6 /100 | #72 | Exceptional 11.5% |
| Immigrants | North Macedonia | 99.6 /100 | #73 | Exceptional 11.5% |
| Taiwanese | 99.6 /100 | #74 | Exceptional 11.5% |
| Immigrants | Northern Africa | 99.6 /100 | #75 | Exceptional 11.5% |
| Albanians | 99.6 /100 | #76 | Exceptional 11.5% |
| Immigrants | Italy | 99.5 /100 | #77 | Exceptional 11.5% |
| Afghans | 99.4 /100 | #78 | Exceptional 11.5% |
| Guyanese | 99.4 /100 | #79 | Exceptional 11.5% |
| Immigrants | Switzerland | 99.4 /100 | #80 | Exceptional 11.5% |
| Russians | 99.4 /100 | #81 | Exceptional 11.5% |