Indian (Asian) vs Iroquois Divorced or Separated
COMPARE
Indian (Asian)
Iroquois
Divorced or Separated
Divorced or Separated Comparison
Indians (Asian)
Iroquois
10.2%
DIVORCED OR SEPARATED
100.0/ 100
METRIC RATING
6th/ 347
METRIC RANK
12.9%
DIVORCED OR SEPARATED
0.0/ 100
METRIC RATING
289th/ 347
METRIC RANK
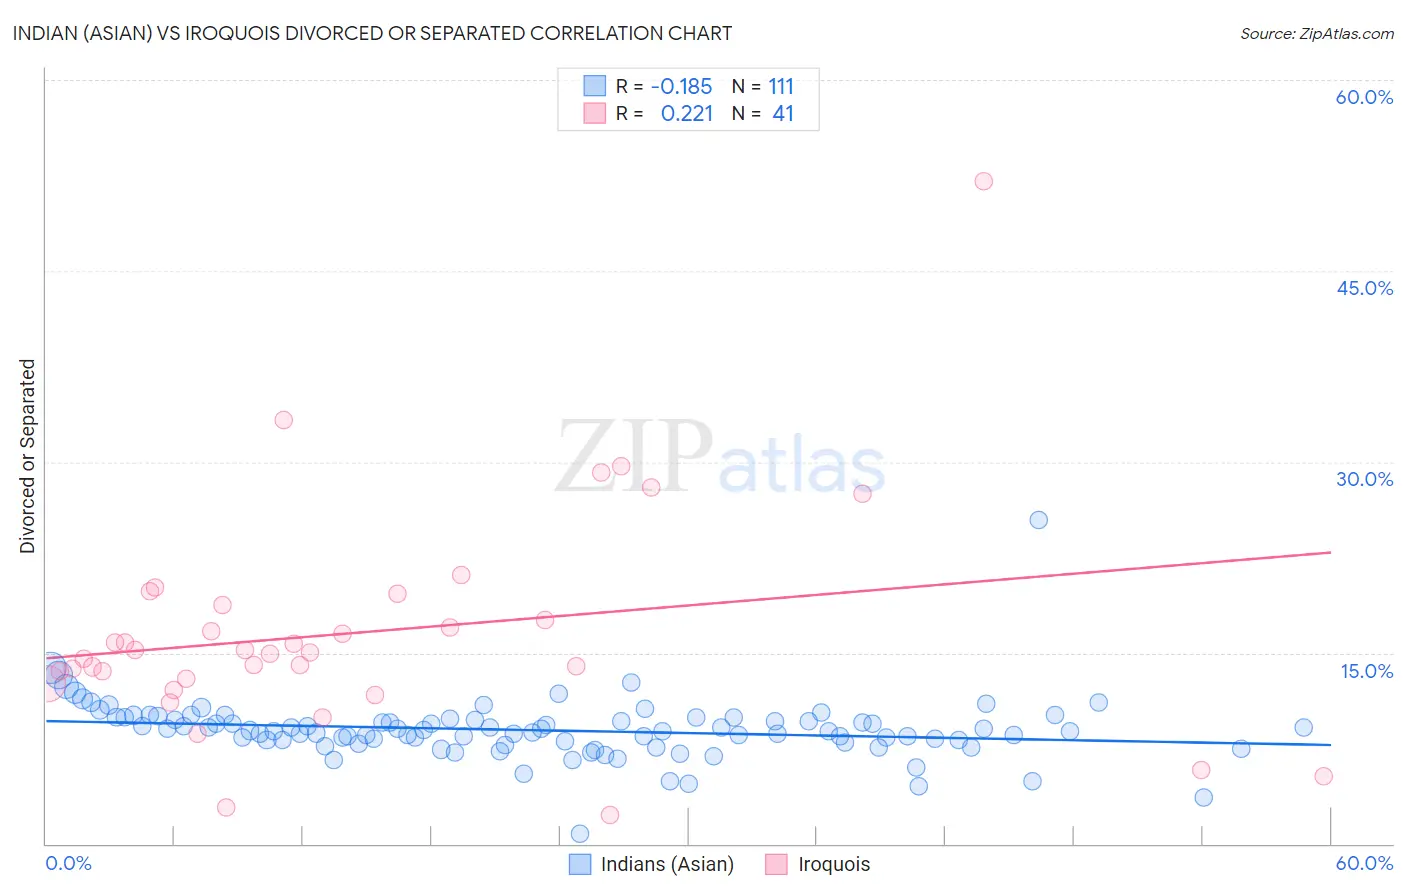
Indian (Asian) vs Iroquois Divorced or Separated Correlation Chart
The statistical analysis conducted on geographies consisting of 494,939,587 people shows a poor negative correlation between the proportion of Indians (Asian) and percentage of population currently divorced or separated in the United States with a correlation coefficient (R) of -0.185 and weighted average of 10.2%. Similarly, the statistical analysis conducted on geographies consisting of 207,262,032 people shows a weak positive correlation between the proportion of Iroquois and percentage of population currently divorced or separated in the United States with a correlation coefficient (R) of 0.221 and weighted average of 12.9%, a difference of 26.1%.
Divorced or Separated Correlation Summary
| Measurement | Indian (Asian) | Iroquois |
| Minimum | 0.80% | 2.3% |
| Maximum | 25.4% | 52.0% |
| Range | 24.6% | 49.7% |
| Mean | 8.9% | 16.6% |
| Median | 8.8% | 15.0% |
| Interquartile 25% (IQ1) | 8.0% | 12.8% |
| Interquartile 75% (IQ3) | 9.8% | 19.2% |
| Interquartile Range (IQR) | 1.8% | 6.4% |
| Standard Deviation (Sample) | 2.4% | 8.8% |
| Standard Deviation (Population) | 2.4% | 8.7% |
Similar Demographics by Divorced or Separated
Demographics Similar to Indians (Asian) by Divorced or Separated
In terms of divorced or separated, the demographic groups most similar to Indians (Asian) are Thai (10.2%, a difference of 0.050%), Immigrants from Eastern Asia (10.2%, a difference of 0.39%), Yup'ik (10.3%, a difference of 0.83%), Immigrants from India (10.1%, a difference of 1.3%), and Immigrants from Singapore (10.3%, a difference of 1.4%).
| Demographics | Rating | Rank | Divorced or Separated |
| Immigrants | Taiwan | 100.0 /100 | #1 | Exceptional 9.8% |
| Filipinos | 100.0 /100 | #2 | Exceptional 9.9% |
| Immigrants | Hong Kong | 100.0 /100 | #3 | Exceptional 10.0% |
| Immigrants | China | 100.0 /100 | #4 | Exceptional 10.0% |
| Immigrants | India | 100.0 /100 | #5 | Exceptional 10.1% |
| Indians (Asian) | 100.0 /100 | #6 | Exceptional 10.2% |
| Thais | 100.0 /100 | #7 | Exceptional 10.2% |
| Immigrants | Eastern Asia | 100.0 /100 | #8 | Exceptional 10.2% |
| Yup'ik | 100.0 /100 | #9 | Exceptional 10.3% |
| Immigrants | Singapore | 100.0 /100 | #10 | Exceptional 10.3% |
| Immigrants | South Central Asia | 100.0 /100 | #11 | Exceptional 10.4% |
| Okinawans | 100.0 /100 | #12 | Exceptional 10.5% |
| Cypriots | 100.0 /100 | #13 | Exceptional 10.5% |
| Assyrians/Chaldeans/Syriacs | 100.0 /100 | #14 | Exceptional 10.6% |
| Immigrants | Armenia | 100.0 /100 | #15 | Exceptional 10.6% |
Demographics Similar to Iroquois by Divorced or Separated
In terms of divorced or separated, the demographic groups most similar to Iroquois are Pima (12.9%, a difference of 0.14%), French Canadian (12.8%, a difference of 0.15%), Immigrants from Honduras (12.9%, a difference of 0.26%), Scotch-Irish (12.9%, a difference of 0.32%), and Honduran (12.8%, a difference of 0.41%).
| Demographics | Rating | Rank | Divorced or Separated |
| Sub-Saharan Africans | 0.1 /100 | #282 | Tragic 12.7% |
| Delaware | 0.1 /100 | #283 | Tragic 12.7% |
| Immigrants | Nonimmigrants | 0.1 /100 | #284 | Tragic 12.8% |
| French | 0.1 /100 | #285 | Tragic 12.8% |
| Spanish | 0.1 /100 | #286 | Tragic 12.8% |
| Hondurans | 0.1 /100 | #287 | Tragic 12.8% |
| French Canadians | 0.1 /100 | #288 | Tragic 12.8% |
| Iroquois | 0.0 /100 | #289 | Tragic 12.9% |
| Pima | 0.0 /100 | #290 | Tragic 12.9% |
| Immigrants | Honduras | 0.0 /100 | #291 | Tragic 12.9% |
| Scotch-Irish | 0.0 /100 | #292 | Tragic 12.9% |
| Jamaicans | 0.0 /100 | #293 | Tragic 12.9% |
| Apache | 0.0 /100 | #294 | Tragic 12.9% |
| Celtics | 0.0 /100 | #295 | Tragic 13.0% |
| Nicaraguans | 0.0 /100 | #296 | Tragic 13.0% |