Brazilian vs Kenyan Births to Unmarried Women
COMPARE
Brazilian
Kenyan
Births to Unmarried Women
Births to Unmarried Women Comparison
Brazilians
Kenyans
30.4%
BIRTHS TO UNMARRIED WOMEN
84.8/ 100
METRIC RATING
135th/ 347
METRIC RANK
31.9%
BIRTHS TO UNMARRIED WOMEN
43.0/ 100
METRIC RATING
182nd/ 347
METRIC RANK
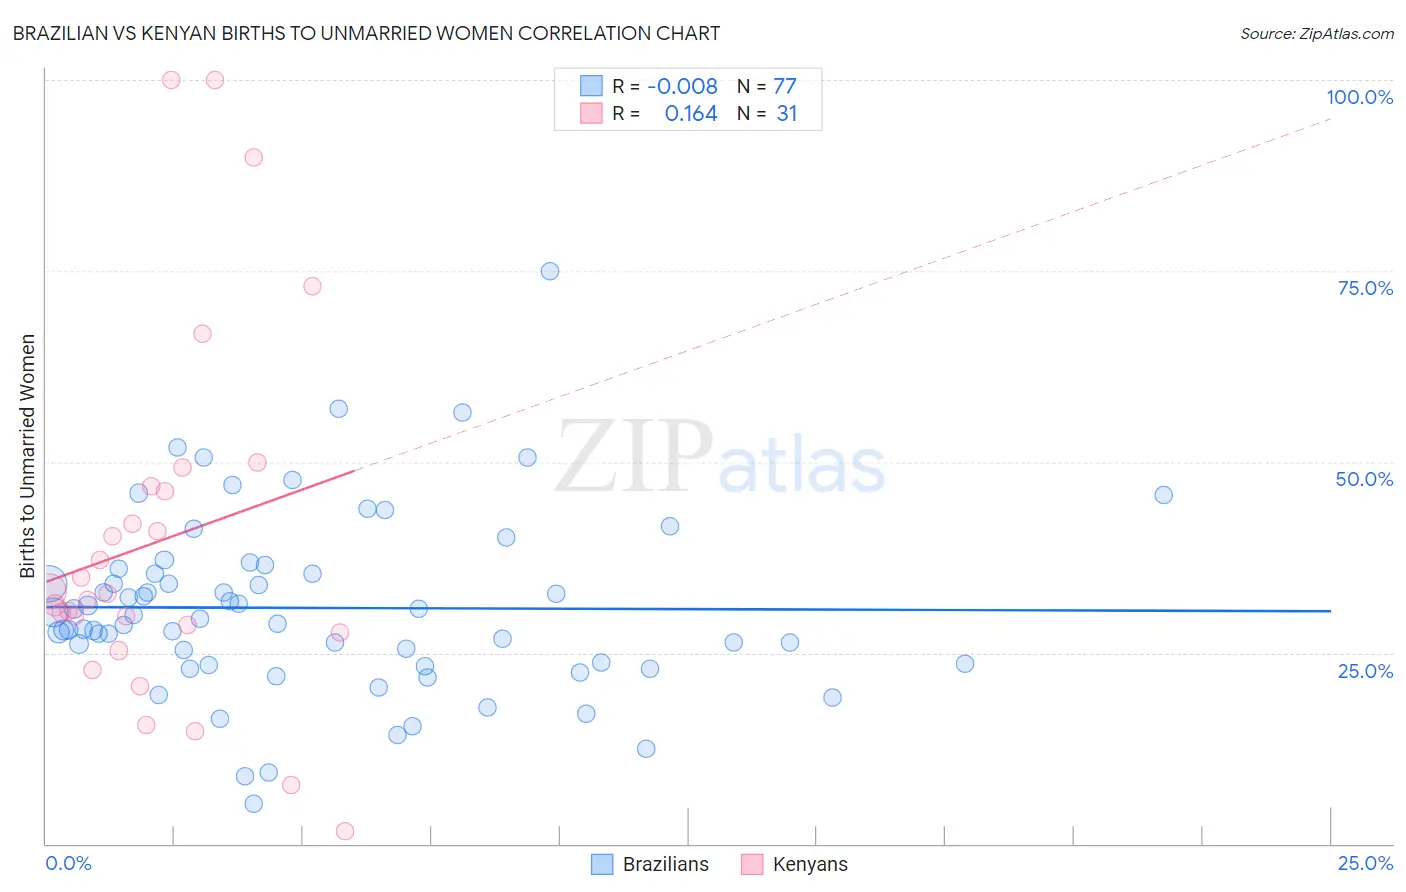
Brazilian vs Kenyan Births to Unmarried Women Correlation Chart
The statistical analysis conducted on geographies consisting of 304,585,920 people shows no correlation between the proportion of Brazilians and percentage of births to unmarried women in the United States with a correlation coefficient (R) of -0.008 and weighted average of 30.4%. Similarly, the statistical analysis conducted on geographies consisting of 163,852,803 people shows a poor positive correlation between the proportion of Kenyans and percentage of births to unmarried women in the United States with a correlation coefficient (R) of 0.164 and weighted average of 31.9%, a difference of 4.9%.
Births to Unmarried Women Correlation Summary
| Measurement | Brazilian | Kenyan |
| Minimum | 5.3% | 1.6% |
| Maximum | 74.9% | 100.0% |
| Range | 69.6% | 98.4% |
| Mean | 30.9% | 39.7% |
| Median | 29.4% | 32.7% |
| Interquartile 25% (IQ1) | 23.4% | 27.6% |
| Interquartile 75% (IQ3) | 35.7% | 46.9% |
| Interquartile Range (IQR) | 12.3% | 19.3% |
| Standard Deviation (Sample) | 11.8% | 24.0% |
| Standard Deviation (Population) | 11.7% | 23.7% |
Similar Demographics by Births to Unmarried Women
Demographics Similar to Brazilians by Births to Unmarried Women
In terms of births to unmarried women, the demographic groups most similar to Brazilians are Immigrants from Scotland (30.4%, a difference of 0.030%), Immigrants from South Eastern Asia (30.4%, a difference of 0.070%), Immigrants from Morocco (30.4%, a difference of 0.080%), New Zealander (30.3%, a difference of 0.13%), and Immigrants from Zimbabwe (30.3%, a difference of 0.16%).
| Demographics | Rating | Rank | Births to Unmarried Women |
| Icelanders | 86.0 /100 | #128 | Excellent 30.3% |
| Immigrants | Spain | 85.8 /100 | #129 | Excellent 30.3% |
| Immigrants | Bosnia and Herzegovina | 85.7 /100 | #130 | Excellent 30.3% |
| Immigrants | Zimbabwe | 85.7 /100 | #131 | Excellent 30.3% |
| New Zealanders | 85.5 /100 | #132 | Excellent 30.3% |
| Immigrants | Morocco | 85.2 /100 | #133 | Excellent 30.4% |
| Immigrants | South Eastern Asia | 85.2 /100 | #134 | Excellent 30.4% |
| Brazilians | 84.8 /100 | #135 | Excellent 30.4% |
| Immigrants | Scotland | 84.6 /100 | #136 | Excellent 30.4% |
| Immigrants | Philippines | 83.9 /100 | #137 | Excellent 30.4% |
| Puget Sound Salish | 83.9 /100 | #138 | Excellent 30.4% |
| Immigrants | Canada | 83.7 /100 | #139 | Excellent 30.4% |
| Swiss | 83.1 /100 | #140 | Excellent 30.5% |
| Pakistanis | 83.0 /100 | #141 | Excellent 30.5% |
| South Africans | 82.7 /100 | #142 | Excellent 30.5% |
Demographics Similar to Kenyans by Births to Unmarried Women
In terms of births to unmarried women, the demographic groups most similar to Kenyans are Canadian (31.9%, a difference of 0.16%), Immigrants from Peru (31.8%, a difference of 0.20%), Immigrants from South America (32.0%, a difference of 0.23%), Moroccan (31.8%, a difference of 0.26%), and German (32.0%, a difference of 0.34%).
| Demographics | Rating | Rank | Births to Unmarried Women |
| Immigrants | Venezuela | 49.2 /100 | #175 | Average 31.7% |
| Scottish | 48.1 /100 | #176 | Average 31.7% |
| South American Indians | 47.7 /100 | #177 | Average 31.7% |
| English | 47.4 /100 | #178 | Average 31.7% |
| South Americans | 46.9 /100 | #179 | Average 31.8% |
| Moroccans | 45.7 /100 | #180 | Average 31.8% |
| Immigrants | Peru | 45.1 /100 | #181 | Average 31.8% |
| Kenyans | 43.0 /100 | #182 | Average 31.9% |
| Canadians | 41.4 /100 | #183 | Average 31.9% |
| Immigrants | South America | 40.7 /100 | #184 | Average 32.0% |
| Germans | 39.5 /100 | #185 | Fair 32.0% |
| Welsh | 38.2 /100 | #186 | Fair 32.0% |
| Czechoslovakians | 38.0 /100 | #187 | Fair 32.0% |
| Osage | 37.1 /100 | #188 | Fair 32.1% |
| Immigrants | Kenya | 36.9 /100 | #189 | Fair 32.1% |